mirror of
https://github.com/jkriege2/JKQtPlotter.git
synced 2025-02-19 02:39:26 +08:00
114 lines
5.2 KiB
Markdown
114 lines
5.2 KiB
Markdown
# Example (JKQTPlotter): Plotting Mathematical Functions as Line Graphs {#JKQTPlotterFunctionPlots}
|
|
## Basics
|
|
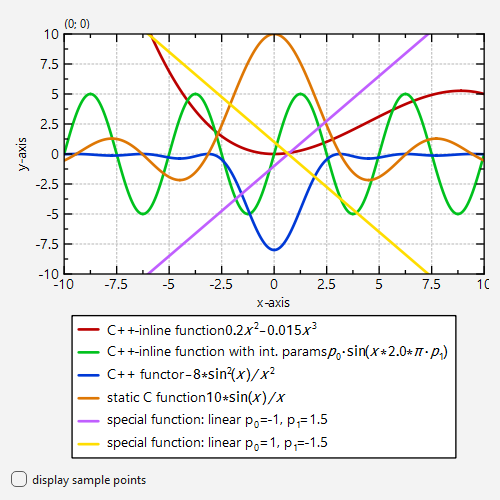
This project (see `./examples/functionplot/`) demonstrates how to plot mathematical functions as line graphs. The functions may be defined as static C functions, C++ functors or c++ inline functions. See [examples/parsedfunctionplot](https://github.com/jkriege2/JKQtPlotter/tree/master/examples/parsedfunctionplot) for an example of how to use an internal equation parser provided with JKQTPlotter instead of directly defining functions.
|
|
|
|
[TOC]
|
|
|
|
# Simple C++ inline function
|
|
The first example shows how to plot a C++ inline function:
|
|
```.cpp
|
|
JKQTPXFunctionLineGraph* func1=new JKQTPXFunctionLineGraph(plot);
|
|
func1->setPlotFunctionFunctor([](double x) { return 0.2*x*x-0.015*x*x*x; });
|
|
func1->setTitle("C++-inline function $0.2x^2-0.015x^3$");
|
|
plot->addGraph(func1);
|
|
```
|
|
|
|
# Simple C++ inline function with parameters
|
|
|
|
In any such plot function, you can also use parameters, provided via the second parameter. Usually these are "internal parameters", defined by `func2->setParamsV(p0, p1, ...)`:
|
|
```.cpp
|
|
JKQTPXFunctionLineGraph* func2=new JKQTPXFunctionLineGraph(plot);
|
|
func2->setPlotFunctionFunctor([](double x, const QVector<double>& p) {
|
|
return p.at(0)*sin(2.0*JKQTPSTATISTICS_PI*x*p.at(1));
|
|
}); // here we set the parameters p0, p1
|
|
func2->setParamsV(5, 0.2);
|
|
func2->setTitle("C++-inline function with int. params $p_0\\cdot\\sin(x*2.0*\\pi\\cdot p_1)$");
|
|
plot->addGraph(func2);
|
|
```
|
|
|
|
|
|
# C++ functors as plot functions
|
|
|
|
You can also use C++ functors (or function objects):
|
|
```.cpp
|
|
struct SincSqr {
|
|
public:
|
|
inline SincSqr(double amplitude): a(amplitude) {}
|
|
inline double operator()(double x) {
|
|
return a*sin(x)*sin(x)/x/x;
|
|
}
|
|
private:
|
|
double a;
|
|
};
|
|
|
|
// ...
|
|
|
|
JKQTPXFunctionLineGraph* func4=new JKQTPXFunctionLineGraph(plot);
|
|
func4->setPlotFunctionFunctor(SincSqr(-8));
|
|
func4->setTitle("C++ functor $-8*\\sin^2(x)/x^2$");
|
|
plot->addGraph(func4);
|
|
```
|
|
|
|
# Static C functions
|
|
|
|
You can also plot simple static C functions:
|
|
```.cpp
|
|
double sinc(double x) {
|
|
return 10.0*sin(x)/x;
|
|
}
|
|
|
|
// ...
|
|
|
|
JKQTPXFunctionLineGraph* func5=new JKQTPXFunctionLineGraph(plot);
|
|
func5->setPlotFunctionFunctor(&sinc);
|
|
func5->setTitle("static C function $10*\\sin(x)/x$");
|
|
plot->addGraph(func5);
|
|
```
|
|
|
|
# Predefined "special" functions
|
|
|
|
Finally `JKQTPXFunctionLineGraph` provides a small set of special functions (polynomial `p0+p1*x+p2*x^2+...`, exponential `p0+p1*exp(x/p2)`, power-law `p0+p1*x^p2`, ...), which are parametrized from the internal or external parameters:
|
|
```.cpp
|
|
JKQTPXFunctionLineGraph* func6=new JKQTPXFunctionLineGraph(plot);
|
|
func6->setSpecialFunction(JKQTPXFunctionLineGraph::Line);
|
|
// here we set offset p0=-1 and slope p1=1.5 of the line p0+p1*x
|
|
func6->setParamsV(-1,1.5);
|
|
func6->setTitle("special function: linear");
|
|
plot->addGraph(func6);
|
|
```
|
|
|
|
To demonstrate how to use parameters from a datastore column, have a look at the next example. It is derived from the special-function plot above, but adds a line with a different offset and slope and reads the parameters from a datastore column `paramCol`, which is initialized from the vector `params`:
|
|
```.cpp
|
|
JKQTPXFunctionLineGraph* func7=new JKQTPXFunctionLineGraph(plot);
|
|
func7->setSpecialFunction(JKQTPXFunctionLineGraph::Line);
|
|
// here we set offset p0=1 and slope p1=-1.5 of the line p0+p1*x by adding these into a column
|
|
// in the internal datastore and then set that column as parameterColumn for the function graph
|
|
QVector<double> params;
|
|
params << /*p0=*/1 << /*p1=*/-1.5;
|
|
size_t paramCol=plot->getDatastore()->addCopiedColumn(params);
|
|
func7->setParameterColumn(paramCol);
|
|
func7->setTitle("special function: linear");
|
|
plot->addGraph(func7);
|
|
```
|
|
|
|
# Screenshot
|
|
|
|
This code snippets above result in a plot like this:
|
|
|
|

|
|
|
|
# Notes
|
|
|
|
Note that all the different variants to provide parameters can be used with all types of functions!
|
|
|
|
Also see the example [Plotting Parsed Mathematical Functions as Line Graphs](https://github.com/jkriege2/JKQtPlotter/tree/master/examples/parsedfunctionplot) for details on how the actual plotting algorithm works. That example also shows how to define a function as a string, which is then parsed and evaluated by an expression parser library embedded in JKQTPlotter.
|
|
|
|
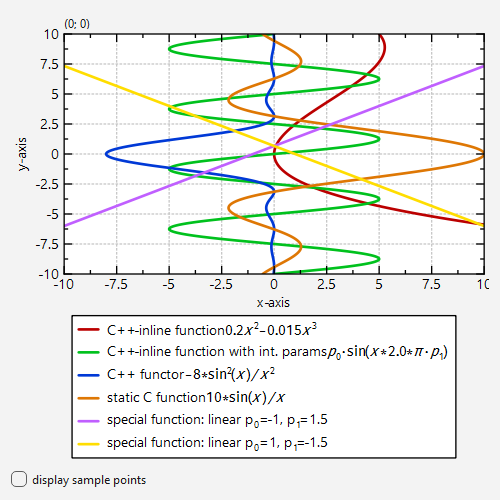
All examples above use the graph class `JKQTPXFunctionLineGraph`, which plots a function `y=f(x)`. If you want to plot a function `x=f(y)`, you can use the class `JKQTPYFunctionLineGraph` instead. If in the examples above, we exchange all `JKQTPXFunctionLineGraph` for `JKQTPYFunctionLineGraph`, the graphs will be rotated by 90 degree, as all functions are interpreted as `x=f(y)`:
|
|
|
|

|
|
|
|
|
|
This example describes how to draw 1D functions. For an example of how to draw 2D parametric curves `[x,y]=f(t)`, see [examples/evalcurve](https://github.com/jkriege2/JKQtPlotter/tree/master/examples/evalcurve) .
|
|
|
|
|