mirror of
https://github.com/jkriege2/JKQtPlotter.git
synced 2025-01-24 06:32:12 +08:00
NEW/BREAKING: refactor CMake-Code, so static/dynamic switch is done via <code>BUILD_SHARED_LIBS</code>, which retires <code>JKQtPlotter_BUILD_STATIC_LIBS</code>, <code>JKQtPlotter_BUILD_SHARED_LIBS</code> and removes the capability to build static and shared libraries in one location (fixes issue #104)
NEW: prepareed library for CMake's <a href="https://cmake.org/cmake/help/latest/module/FetchContent.html">FetchContent</a>-API
NEW: the different sub-libraries JKQTPlotter, JKQTFastPlotter (DEPRECATED), JKQTMath, JKQTMathText can be activated/deactivated with CMake options JKQtPlotter_BUILD_LIB_JKQTPLOTTER, JKQtPlotter_BUILD_LIB_JKQTFASTPLOTTER, JKQtPlotter_BUILD_LIB_JKQTMATHTEXT, JKQtPlotter_BUILD_LIB_JKQTMATH
2.1 KiB
2.1 KiB
Example (JKQTPlotter): Very simple line-graph
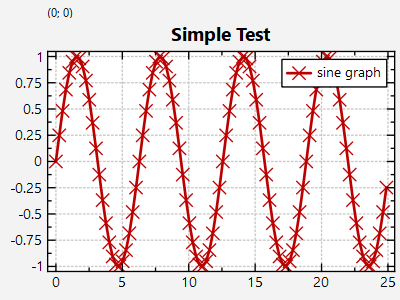
This project (see ./examples/simpletest/) simply creates a JKQTPlotter widget (as a new window) and adds a single line-graph (a sine-wave). Data is initialized from two QVector objects.
The source code of the main application is (see jkqtplotter_simpletest.cpp:
#include <QApplication>
#include "jkqtplotter/jkqtplotter.h"


int main(int argc, char* argv[])
{
    QApplication app(argc, argv);

    // 1. create a plotter window and get a pointer to the internal datastore
	//    (for convenience)
    JKQTPlotter plot;
    JKQTPDatastore* ds=plot.getDatastore();

    // 2. now we create data for a simple plot (a sine curve)
    QVector<double> X, Y;
    const int Ndata=100;
    for (int i=0; i<Ndata; i++) {
        const double x=double(i)/double(Ndata)*8.0*M_PI;
        X<<x;
        Y<<sin(x);
    }

    // 3. make data available to JKQTPlotter by adding it to the internal
	//    datastore.
    //    Note: In this step the data is copied (of not specified otherwise), so
    //          you can reuse X and Y afterwards!
    //    The variables columnX and columnY will contain the internal column ID
    //    of the newlycreated columns with names "x" and "y" and the (copied)
	//    data from X and Y.
    size_t columnX=ds->addCopiedColumn(X, "x");
    size_t columnY=ds->addCopiedColumn(Y, "y");

    // 4. create a graph in the plot, which plots the dataset X/Y:
    JKQTPXYLineGraph* graph1=new JKQTPXYLineGraph(&plot);
    graph1->setXColumn(columnX);
    graph1->setYColumn(columnY);
    graph1->setTitle(QObject::tr("sine graph"));

    // 5. add the graph to the plot, so it is actually displayed
    plot.addGraph(graph1);

    // 6. autoscale the plot so the graph is contained
    plot.zoomToFit();

    // show plotter and make it a decent size
    plot.show();
    plot.resize(600,400);

    return app.exec();
}
The result looks like this:
