2.6 KiB
Example (JKQtPlotter): Line Graph with Different Symbols and Line Styles
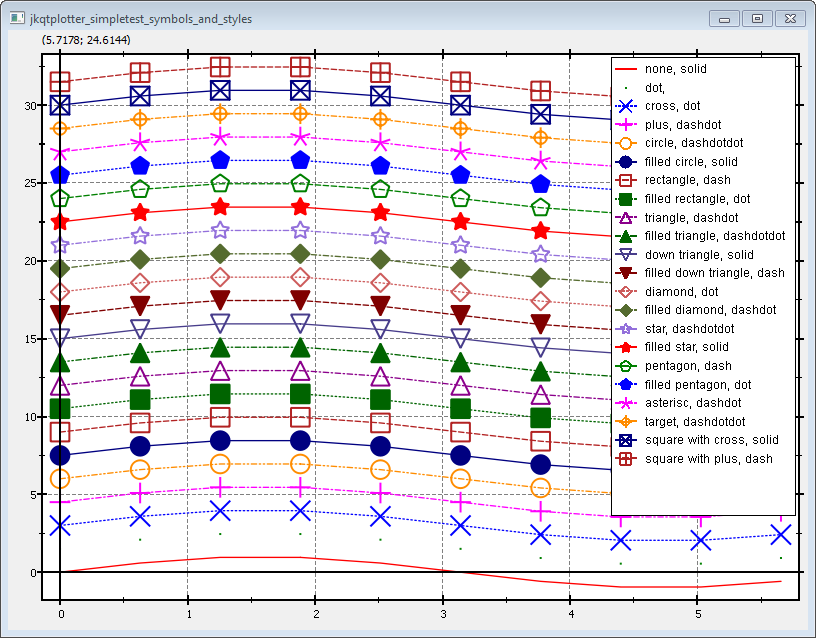
This project (see ./examples/simpletest_symbols_and_styles/) simply creates a JKQtPlotter widget (as a new window) and adds a single line-graph (a sine-wave). Data is initialized from two QVector objects.
The source code of the main application can be found in jkqtplotter_simpletest_symbols_and_styles.cpp. Mainly several graphs are generated in a loop and then different symbol and line styles are applied to the graph (set by graph->set_symbol() for the symbol and graph->set_style() for the line style). The colors are set automtically from an internal default palette. The main loop looks like this:
	QVector<Qt::PenStyle> pens {Qt::NoPen, Qt::SolidLine, Qt::DashLine, Qt::DotLine, Qt::DashDotLine, Qt::DashDotDotLine };
    int ipen=0;
    for (int symbolID=0; symbolID<=JKQTPmaxSymbolID; symbolID++) {
        // generate some plot data
        QVector<double> Y;
        for (auto& xx: X) {
            Y<<sin(xx)+static_cast<double>(symbolID)*1.5;
        }

        JKQTPxyLineGraph* graph=new JKQTPxyLineGraph(&plot);

        // copy data into datastore and immediately set the yColumn
        graph->set_xColumn(columnX);
        graph->set_yColumn(ds->addCopiedColumn(Y, "y"+QString::number(symbolID)));

        // set symbol + pen style and color
        graph->set_symbol(static_cast<JKQTPgraphSymbols>(symbolID));
        graph->set_style(pens[ipen]);
        // set symbol size
        graph->set_symbolSize(14);
        // set width of symbol lines
        graph->set_symbolWidth(1.5);
        // set width of graph line
        graph->set_lineWidth(1);

        // graph title is made from symbol+penstyle
        graph->set_title(JKQTPgraphSymbols2NameString(static_cast<JKQTPgraphSymbols>(graph->get_symbol()))+QString(", ")+JKQTP_QPenStyle2String(graph->get_style()));

        // add the graph to the plot, so it is actually displayed
        plot.addGraph(graph);

        ipen++;
        if (ipen>=pens.size()) ipen=0;
    }
In addition to the symbol type and line style, you can also alter the size of the symbols (graph->set_symbolSize(14)), the line-width used to draw them (graph->set_symbolWidth(1.5)) and the line width of the graph line (graph->set_lineWidth(1)). If you want to switch off the line altogether, use graph->set_drawLine(false.
The result looks like this:
