6.8 KiB
Example (JKQTPlotter): Plotting Geometric Objects
This project shows the capabilities of JKQTPlotter plot to also draw geometric elements, like circles, ellipses, rectangles etc.
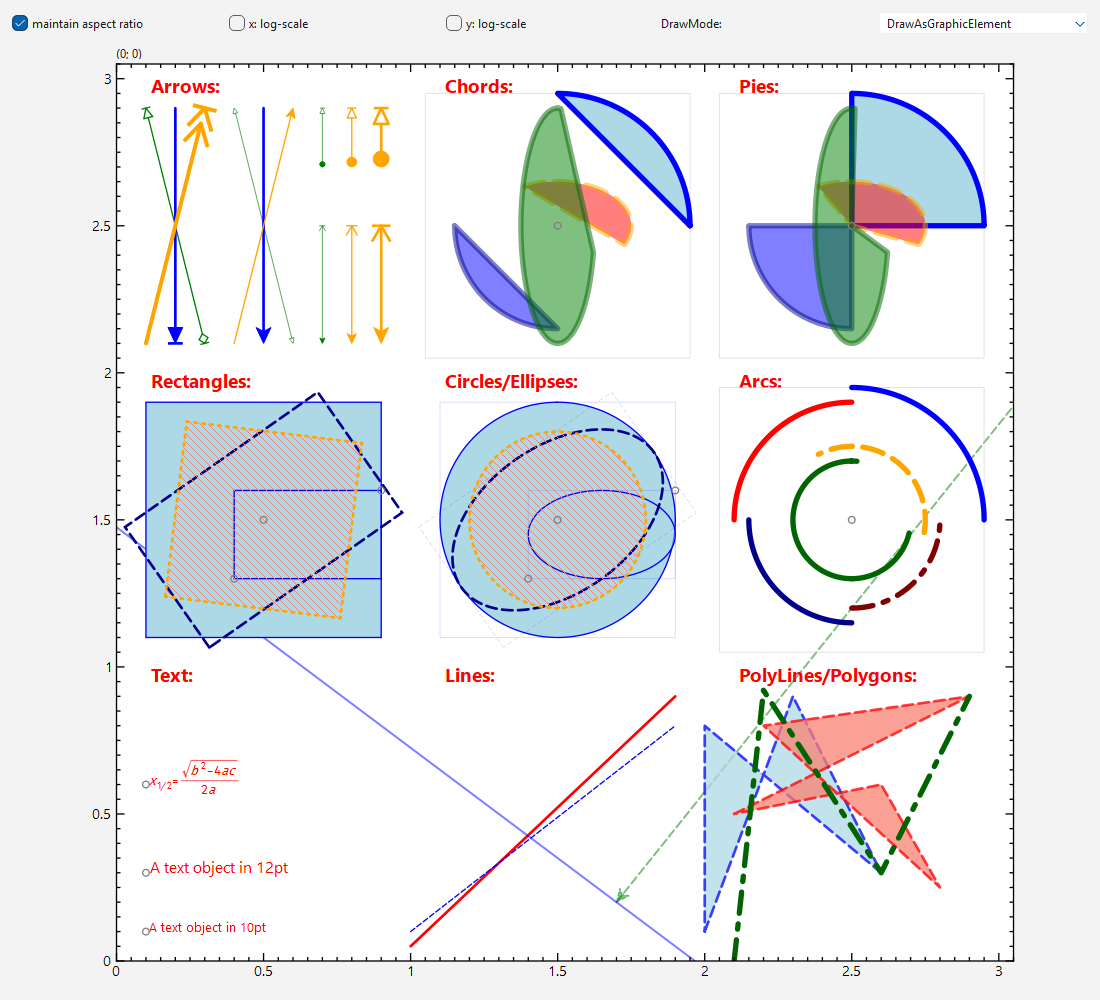
The source code of the main application can be found in geometric.cpp. First a plot is generated and the axis aspect ratio is set to 1, so an accurate plot is generated. Then several geometric graphs are added to the plot-> Here are some examples, you can find more more examples in the source code of the example:
    // a text element
    plot->addGraph(new JKQTPGeoText(plot, 0.1,0.6, "$x_{1/2}=\\frac{\\sqrt{b^2-4ac}}{2a}$", 10, QColor("red")));


    // a single symbol
    plot->addGraph(new JKQTPGeoSymbol(plot, 0.1,0.6, JKQTPCircle, 5, QColor("grey")));


    // a line
    plot->addGraph(new JKQTPGeoLine(plot, 1,  0.05, 1.9, 0.9, QColor("red"), 2));

    // an arrow
    plot->addGraph(new JKQTPGeoArrow(plot, 0.4,  2.5, 0.4, 2.65, QColor("green"), JKQTPArrowAndStop, JKQTPFilledArrow, 1));


    // a one-sided infinite line with slope dy/dx=0.25/0.2
    JKQTPGeoInfiniteLine* infLine=new JKQTPGeoInfiniteLine(plot, 1.7,  0.2, 0.2, 0.25, QColor("green"), 1.5, Qt::PenStyle::DashLine);
    infLine->setTwoSided(false);
    infLine->setAlpha(0.5);
    plot->addGraph(infLine);


    // a polyline
    QVector<QPointF> p;
    p<<QPointF(2.1, 0.0)<<QPointF(2.2, 0.92)<<QPointF(2.6, 0.3)<<QPointF(2.9, 0.9);
    plot->addGraph(new JKQTPGeoPolyLines(plot, p, QColor("darkgreen"), 4, Qt::PenStyle::DashDotLine));


    // rectangle:
    plot->addGraph(new JKQTPGeoRectangle(plot, QPointF(0.4,1.3), QPointF(0.9,1.6), QColor("blue"), 1, Qt::SolidLine, rfill));
    // a rotated rectangle (rotated by 35 degrees):
    plot->addGraph(new JKQTPGeoRectangle(plot, 0.5,1.5,0.8,0.5, 35, QColor("darkblue"), 2, Qt::DashLine));


    // ellipse:
    plot->addGraph(new JKQTPGeoEllipse(plot, QPointF(0.4,1.3), QPointF(0.9,1.6), QColor("blue"), 1, Qt::SolidLine, rfill));
    // a rotated ellipse (rotated by 35 degrees):
    plot->addGraph(new JKQTPGeoEllipse(plot, 0.5,1.5,0.8,0.5, 35, QColor("darkblue"), 2, Qt::DashLine));


    // a polygon
    JKQTPGeoPolygon* polygongraph=new JKQTPGeoPolygon(plot, QColor("red"), 2, Qt::PenStyle::DashLine, QColor("salmon"));
    polygongraph->appendPoint(2.1, 0.5);
    polygongraph->appendPoint(2.9, 0.9);
    polygongraph->appendPoint(2.2, 0.8);
    polygongraph->appendPoint(2.8, 0.25);
    polygongraph->appendPoint(2.6, 0.6);
    polygongraph->setAlpha(0.75);
    plot->addGraph(polygongraph);


    // an arc from an ellipse from -10 degrees to 117 degrees, centered at 2.5,1.5 and full axes of 0.5 and 0.5
    plot->addGraph(new JKQTPGeoArc(plot,2.5,1.5,0.5,0.5, -10, 117 , QColor("orange"), 4, Qt::PenStyle::DashLine));


    // a pie centered at 2.5,2.5 with ellipse axes 0.9 and 0.9 and from angle 0 degrees to 90 degrees
    plot->addGraph(new JKQTPGeoPie(plot,2.5,2.5,0.9,0.9, 0, 90 , QColor("blue"), 4, Qt::PenStyle::SolidLine,QColor("lightblue")));


    // a chord centered at 2.5,2.5 with ellipse axes 0.9 and 0.9 and from angle 0 degrees to 90 degrees
    plot->addGraph(new JKQTPGeoChord(plot,2.5,2.5,0.9,0.9, 0, 90 , QColor("blue"), 4, Qt::PenStyle::SolidLine,QColor("lightblue")));
The result of the example combines all these elements and looks like this:
The example also adds some control-widgets that allow to change the properties of the plot, especially whether the aspect ratio is maintained and whether the axes have logarithmic scaling. This is achieved by code like this:
    // 1. create a Widget with a plotter and some control-elements
    QWidget widMain;
    QGridLayout* layMain=new QGridLayout;
    widMain.setLayout(layMain);
    JKQTPlotter* plot=new JKQTPlotter(&widMain);
    layMain->addWidget(plot, 1,0,1,5);
    layMain->setRowStretch(1,1);
    QCheckBox* chk;

	// when checkbox is toggled: aspect-ration is maintained, or not
    layMain->addWidget(chk=new QCheckBox(QObject::tr("maintain aspect ratio"), &widMain), 0, 0);
    chk->setChecked(true);
    QObject::connect(chk, &QCheckBox::toggled, [plot](bool checked) {
        plot->getPlotter()->setMaintainAspectRatio(checked);
        plot->getPlotter()->setMaintainAxisAspectRatio(checked);
    });

	// toggling the checkbox switches between linear and log x-axis
    layMain->addWidget(chk=new QCheckBox(QObject::tr("x: log-scale"), &widMain), 0, 1);
    chk->setChecked(false);
    QObject::connect(chk, &QCheckBox::toggled,  plot->getPlotter()->getXAxis(), &JKQTPHorizontalAxis::setLogAxis);
    // toggling the checkbox switches between linear and log y-axis
    layMain->addWidget(chk=new QCheckBox(QObject::tr("y: log-scale"), &widMain), 0, 2);
    chk->setChecked(false);
    QObject::connect(chk, &QCheckBox::toggled,  plot->getPlotter()->getYAxis(), &JKQTPVerticalAxis::setLogAxis);

	QComboBox* cmb;
    // a combobox to select the DrawMode of all graph elements
    layMain->addWidget(new QLabel(QObject::tr("DrawMode: "), &widMain), 0, 3);
    layMain->addWidget(cmb=new QComboBox(&widMain), 0, 4);
    cmb->addItem(QObject::tr("DrawAsGraphicElement"));
    cmb->addItem(QObject::tr("DrawAsMathematicalCurve"));
    cmb->setCurrentIndex(0);
    QObject::connect(cmb, static_cast<void (QComboBox::*)(int)>(&QComboBox::currentIndexChanged), [plot](int index) {
        for (size_t i=0; i<plot->getPlotter()->getGraphCount(); i++) {
            JKQTPGeometricPlotElement* obj=dynamic_cast<JKQTPGeometricPlotElement*>(plot->getPlotter()->getGraph(i));
            if (obj) {
                obj->setDrawMode((index==0)?JKQTPGeometricPlotElement::DrawAsGraphicElement:JKQTPGeometricPlotElement::DrawAsMathematicalCurve);
            }
        }
        plot->redrawPlot();
    });
Now you can play with these controls and see how the different shapes get distorted when these properties change, in dependence of whether the DrawMode is JKQTPGeometricPlotElement::DrawAsMathematicalCurve or JKQTPGeometricPlotElement::DrawAsGraphicElement.
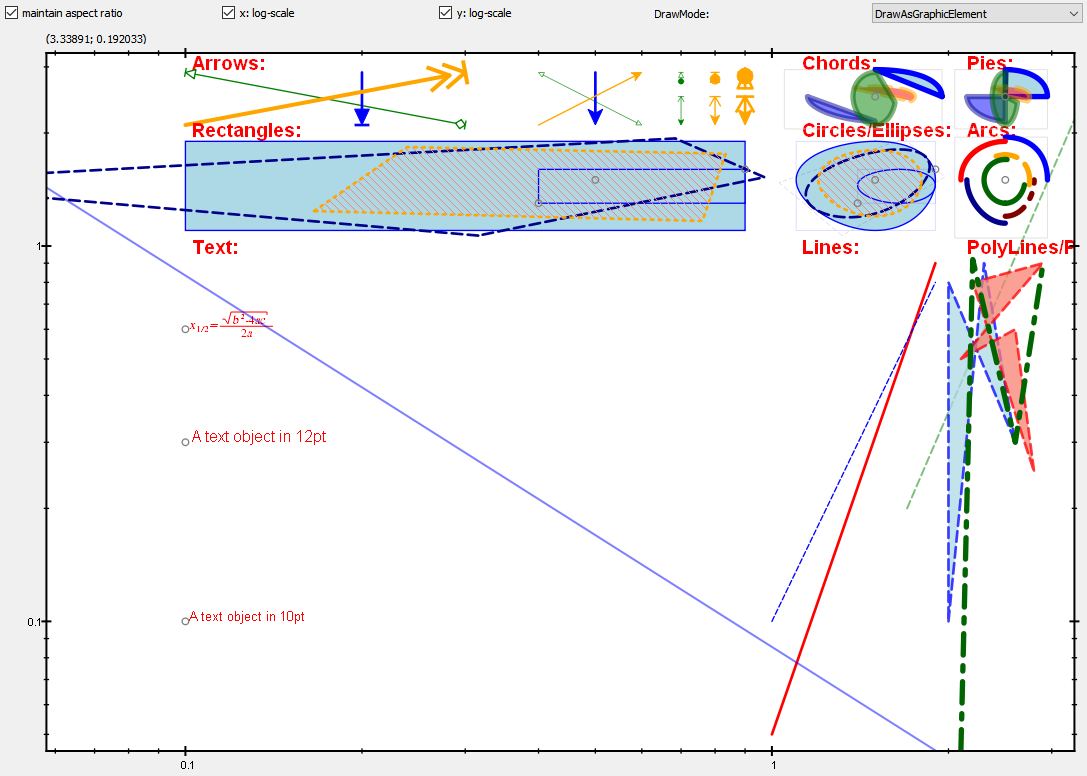
Here is an example on log-log axes and DrawMode = JKQTPGeometricPlotElement::DrawAsGraphicElement:
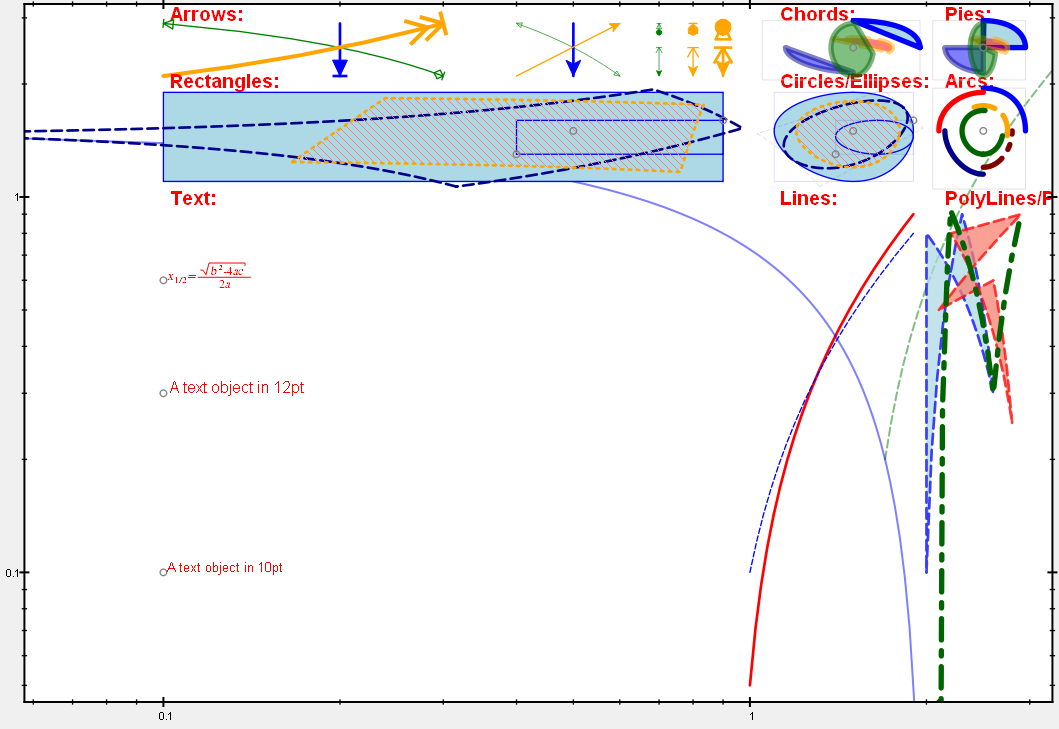
Here is an example on log-log axes and DrawMode = JKQTPGeometricPlotElement::DrawAsMathematicalCurve: Observe how straight lines are bent to the appropriate curve!


