mirror of
https://github.com/jkriege2/JKQtPlotter.git
synced 2025-02-24 17:31:47 +08:00
75 lines
3.1 KiB
Markdown
75 lines
3.1 KiB
Markdown
# Example (JKQTPlotter): Plotting Parametric Mathematical Curves as Line Graphs {#JKQTPlotterEvalCurves}
|
|
## Basics
|
|
This project (see `./examples/evalcurve/`) demonstrates how to plot mathematical functions as line graphs. The functions may be defined as static C functions, C++ functors or c++ inline functions. The functions may simply depend on the parameter `t`, or on `t` and a vector of parameters.
|
|
|
|
The class uses an adaptive algorithm, which determines by the local slope, at how many points (or how close points) the functor has to be evaluated.
|
|
|
|
[TOC]
|
|
|
|
# Simple C++ inline function
|
|
The example shows how to plot a simple C++ inline function:
|
|
|
|
```.cpp
|
|
JKQTPXYFunctionLineGraph* func1=new JKQTPXYFunctionLineGraph(plot);
|
|
func1->setPlotFunctionFunctor([](double t) ->QPointF {
|
|
return QPointF(
|
|
sin(t)*(exp(cos(t))-2.0*cos(4.0*t)-jkqtp_pow5(sin(t/12.0))),
|
|
cos(t)*(exp(cos(t))-2.0*cos(4.0*t)-jkqtp_pow5(sin(t/12.0)))
|
|
);
|
|
});
|
|
func1->setTRange(0, 12.0*JKQTPSTATISTICS_PI);
|
|
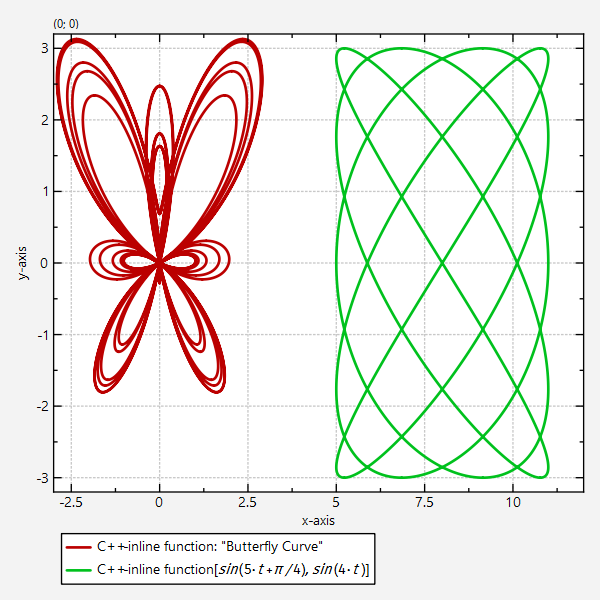
func1->setTitle("C++-inline function: \"Butterfly Curve\"");
|
|
plot->addGraph(func1);
|
|
```
|
|
|
|
Note that here a functor is defined, which calculates the points on a [Butterfly Curve](https://en.wikipedia.org/wiki/Butterfly_curve_(transcendental)), i.e. a function mapping a parameter `t` to a two-dimensional point `QPointF` with complex functions for x and y. This function is evaluated on a range of values for `t`, set by
|
|
|
|
```.cpp
|
|
func1->setTRange(0, 2.0*JKQTPSTATISTICS_PI);
|
|
```
|
|
|
|
# Simple C++ inline function with Parameters
|
|
`JKQTPXYFunctionLineGraph` allows to use more complex functors alternatively: These depend on the variable `t`and a vector of parameters. Here is an example:
|
|
|
|
```.cpp
|
|
func2->setPlotFunctionFunctor([](double t, const QVector<double>& params) ->QPointF {
|
|
return QPointF(
|
|
3.0*sin(params[0]*t+params[2])+8.0,
|
|
3.0*sin(params[1]*t)
|
|
);
|
|
});
|
|
// now we define the 3 parameters of the function
|
|
func2->setParamsV(5, 4, JKQTPSTATISTICS_PI/4.0);
|
|
// and define the range over which to evaluate
|
|
func2->setTRange(0, 2.0*JKQTPSTATISTICS_PI);
|
|
func1->setTitle("C++-inline function $[ sin(5{\\cdot}t+\\pi/4), sin(4{\\cdot}t) ]$");
|
|
plot->addGraph(func1);
|
|
```
|
|
|
|
In the functor we can use the entries in the vector `param` as function parameters. The values in this vector are defined by
|
|
|
|
```.cpp
|
|
// now we define the 3 parameters of the function
|
|
func2->setParamsV(5, 4, JKQTPSTATISTICS_PI/4.0);
|
|
```
|
|
|
|
Alternatively they can also be taken from a column in the internal datastore. Then you have to call:
|
|
|
|
```.cpp
|
|
func2->setParameterColumn(ColumnID);
|
|
```
|
|
|
|
instead, where `ColumnID` is the ID of the column with the parameter values.
|
|
|
|
# Screenshot
|
|
|
|
This code snippets above result in a plot like this:
|
|
|
|
|
|
|
|
# Notes
|
|
|
|
This example describes how to draw 2D parametric curves. For (simpler) 1D-functions f(x) or f(y), see [examples/functionplot](https://github.com/jkriege2/JKQtPlotter/tree/master/examples/functionplot) .
|
|
|
|
|