mirror of
https://github.com/jkriege2/JKQtPlotter.git
synced 2024-11-15 18:15:52 +08:00
9.5 KiB
9.5 KiB
JKQtPlotter
This is an extensive library of function/data plotter classes for Qt (>= 4.7, tested with Qt up to 5.11).
This software is licensed under the term of the GNU Lesser General Public License 2.1 (LGPL 2.1) or above.
Screenshots
Examples
This section assembles some simple examples of usage. You can find more (complex) examples for the classes in this repository in the subfolder "test". All test-projects are Qt-projects that use qmake to build. You can load them into QtCreator easily.
Different Plot Data Styles
| Screenshot | Description | Notes |
|---|---|---|
 |
Very Basic Example (Line Graph) | JKQTPxyLineGraphC++-style QVector arrays of data |
 |
Line Graph with Live Data / Speed Test | JKQTPxyLineGraphexternal std::array<double,N> data, not owned by datastorelive-data, measure plotting speed tipps to increas plotting speed |
 |
Line Graph with Different Symbols and Line Styles | JKQTPxyLineGraphC++ vector of data setting line styles and symbol styles automatic graph coloring |
 |
Step Line Plots in Different Styles | JKQTPstepHorizontalGraph (and JKQTPxyLineGraph)C++ vector of data different step modes, filled and line-only |
 |
Simple Line/Symbol Graph With Errorbars | JKQTPxyLineErrorGraphC-style arrays of data |
 |
Different Types of Error Indicators | JKQTPxyLineErrorGraphdifferent styles of error indicators for x- and y-errors C++-style QVector for data styling error indicators moving key and formatting plotter grid |
 |
Simple Bar Charts | JKQTPbarVerticalGraphC-style arrays of data |
  |
Stacked Bar Charts | JKQTPbarVerticalStackableGraph, JKQTPbarHorizontalStackableGraphC++-style vectors of data |
Styling the Plot, Keys, Axes, ...
| Screenshot | Description | Notes |
|---|---|---|
 |
logarithmic axes | JKQTPxyLineGraph and JKQTPgeoTextC++ vector of data logarithmic axes and styling plot line styles internal LaTeX parser add commenting text to a graph |
   |
date/time axes | JKQTPxyLineGraph and JKQTPfilledVerticalRangeGraphC++ vector of data date/time axes plot min/max range graph internal LaTeX parser data from CSV files |
Image data Plots
| Screenshot | Description | Notes |
|---|---|---|
 |
QImage as a Graph |
JKQTPImageQImage drawn onto a plot with arbitrary scaling) |
 |
Basic 1-channel Raw C Image Plot | JKQTPColumnMathImageimage data copied from C-style row-major array into a single column of the internal datastore Describes several options of the image plotting classes (different ways of color coding, what to do with data above/below the limits etc.) |
 |
Modifier-Feature of Image Plots | JKQTPColumnMathImageimage data copied from C-style row-major array into a single column of the internal datastore Image is modified by a second image to display two data dimensions at the same time |
 |
Basic 1-channel Raw C Image Plot without the internal datastore |
JKQTPMathImageimage data in a C-style row-major array, not using internal datastore |
 |
1-channel OpenCV cv::Mat Image Plot | JKQTPColumnMathImageimage data copied from OpenCV cv::Mat-structure into a single column of the internal datastore |
 |
RGB OpenCV cv::Mat Image Plot | JKQTPColumnRGBMathImageimage data copied from OpenCV cv::Mat-structure into three columns of the internal datastore |
Tools and Special Features
| Screenshot | Description | Notes |
|---|---|---|
 |
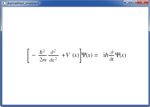
JKQTMathText: LaTeX Renderer |