mirror of
https://github.com/jkriege2/JKQtPlotter.git
synced 2025-01-12 08:50:31 +08:00
117 lines
5.7 KiB
Markdown
117 lines
5.7 KiB
Markdown
# Example (JKQTPlotter): Simple RGB image plot, showing a 3-channel OpenCV cv::Mat {#JKQTPlotterImagePlotRGBOpenCV}
|
|
|
|
This project (see `./examples/rgbimageplot_opencv/`) simply creates a JKQTPlotter widget (as a new window) and shows an RGB image read from a BMP-file. The image is generated as an [OpenCV](https://opencv.org/) [`cv::Mat`](https://docs.opencv.org/4.0.0/d3/d63/classcv_1_1Mat.html) image and then copied into a single column of the internal datastore (JKQTPMathImage could be directly used without the internal datastore).
|
|
To copy the data a special OpenCV Interface function `JKQTPCopyCvMatToColumn()` is used, that copies the data from a (https://opencv.org/) [`cv::Mat`](https://docs.opencv.org/4.0.0/d3/d63/classcv_1_1Mat.html) directly into a column.
|
|
|
|
The function `JKQTPCopyCvMatToColumn()` is available from the (non-default) header-only extension from `jkqtplotter/jkqtpinterfaceopencv.h`. This header provides facilities to interface JKQTPlotter with OpenCV.The OpenCV-binding itself is header-only, and NOT compiled into the JKQtPlotter libraries. Therefore you can simply include the header and use the facilities provided by it.
|
|
|
|
The CMake-build system of JKQtPlotter (and its examples) is compatible with both OpenCV 3.4.x and 4.x and uses the standard `find_package(OpenCV)` facilities provided by OpenCV to compile and bind against that library.
|
|
If you want to build the OpenCV-based JKQtPlotter examples (see list above), you either have to ensure that CMake finds OpenCV by itself (i.e. somewhere in the default search paths), or you can set the CMake variable `OpenCV_DIR` so it points to the OpenCV directory before configuring JKQtPlotter.
|
|
|
|
The source code of the main application is (see [`rgbimageplot_cimg.cpp`](https://github.com/jkriege2/JKQtPlotter/tree/master/examples/rgbimageplot_opencv/rgbimageplot_cimg.cpp):
|
|
```.cpp
|
|
#include <QApplication>
|
|
#include <cmath>
|
|
#include "jkqtplotter/jkqtplotter.h"
|
|
#include "jkqtplotter/graphs/jkqtpimage.h"
|
|
#include "jkqtplotter/jkqtpinterfaceopencv.h"
|
|
#include <opencv2/core.hpp>
|
|
#include <opencv2/imgcodecs.hpp>
|
|
|
|
|
|
|
|
int main(int argc, char* argv[])
|
|
{
|
|
QApplication app(argc, argv);
|
|
|
|
JKQTPlotter plot;
|
|
|
|
|
|
// 1. create a plotter window and get a pointer to the internal datastore (for convenience)
|
|
plot.getPlotter()->setUseAntiAliasingForGraphs(true); // nicer (but slower) plotting
|
|
plot.getPlotter()->setUseAntiAliasingForSystem(true); // nicer (but slower) plotting
|
|
plot.getPlotter()->setUseAntiAliasingForText(true); // nicer (but slower) text rendering
|
|
JKQTPDatastore* ds=plot.getDatastore();
|
|
|
|
|
|
// 2. now we open a BMP-file and load it into an OpenCV cv::Mat
|
|
cv::Mat picture = cv::imread("example.bmp");
|
|
|
|
|
|
|
|
// 3. make data available to JKQTPlotter by adding it to the internal datastore.
|
|
// In this step the contents of each channel of the openCV cv::Mat is copied into a column
|
|
// of the datastore in row-major order
|
|
size_t cPictureR=JKQTPCopyCvMatToColumn(ds, picture, "R-channel", 2);
|
|
size_t cPictureG=JKQTPCopyCvMatToColumn(ds, picture, "G-channel", 1);
|
|
size_t cPictureB=JKQTPCopyCvMatToColumn(ds, picture, "B-channel", 0);
|
|
|
|
|
|
// 4. create a graph (JKQTPColumnRGBMathImage) with the columns created above as data
|
|
JKQTPColumnRGBMathImage* graph=new JKQTPColumnRGBMathImage(&plot);
|
|
graph->setTitle("");
|
|
// where does the image start in the plot, given in plot-axis-coordinates (bottom-left corner)
|
|
graph->setX(0);
|
|
graph->setY(0);
|
|
// width and height of the image in plot-axis-coordinates
|
|
graph->setWidth(picture.cols);
|
|
graph->setHeight(picture.rows);
|
|
// image column with the data
|
|
// Note: this also sets the matrix sized Nx and Ny!!!
|
|
graph->setImageRColumn(cPictureR);
|
|
graph->setImageGColumn(cPictureG);
|
|
graph->setImageBColumn(cPictureB);
|
|
// determine min/max of each channel manually
|
|
graph->setImageMinR(0);
|
|
graph->setImageMaxR(255);
|
|
graph->setImageMinG(0);
|
|
graph->setImageMaxG(255);
|
|
graph->setImageMinB(0);
|
|
graph->setImageMaxB(255);
|
|
|
|
|
|
|
|
// 5. add the graphs to the plot, so it is actually displayed
|
|
plot.addGraph(graph);
|
|
|
|
// 6. set axis labels
|
|
plot.getXAxis()->setAxisLabel("x [pixels]");
|
|
plot.getYAxis()->setAxisLabel("y [pixels]");
|
|
|
|
// 7. fix axis aspect ratio to width/height, so pixels are square
|
|
plot.getPlotter()->setMaintainAspectRatio(true);
|
|
plot.getPlotter()->setAspectRatio(double(picture.cols)/double(picture.rows));
|
|
|
|
// 8. autoscale the plot so the graph is contained
|
|
plot.zoomToFit();
|
|
|
|
// show plotter and make it a decent size
|
|
plot.show();
|
|
plot.resize(800,600);
|
|
plot.setWindowTitle("JKQTPColumnMathImage");
|
|
|
|
|
|
return app.exec();
|
|
}
|
|
|
|
```
|
|
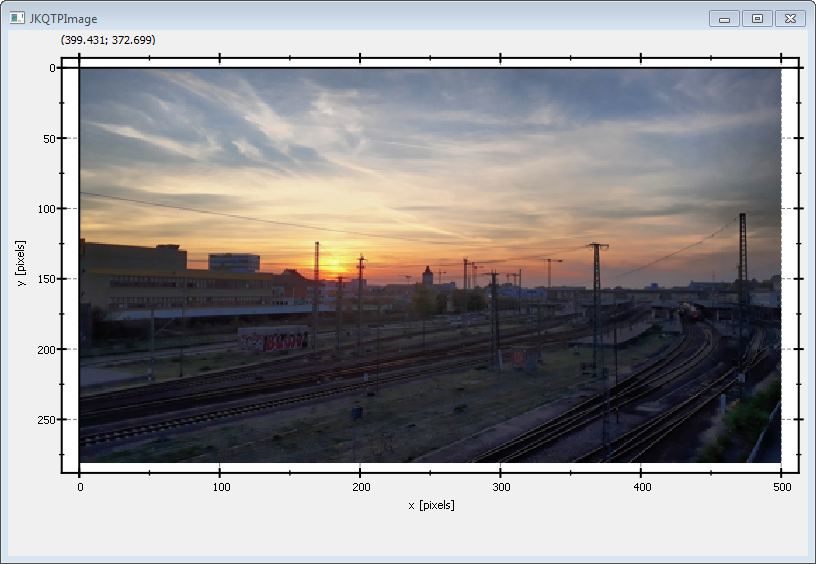
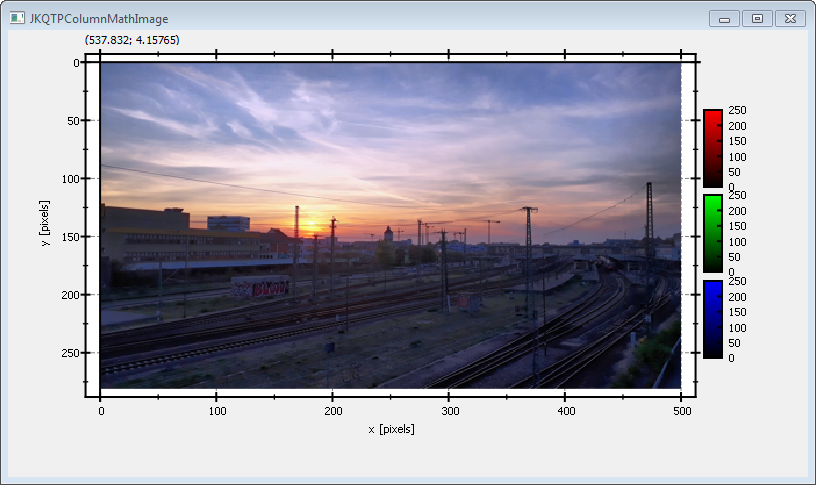
The result looks like this:
|
|
|
|

|
|
|
|
The image is upside-down, because computer images use a coordinate system with 0 at the top-left (left-handed coordinate system) and the JKQTPlotter has its 0 at the bottom-left (right-handed coordinate system).
|
|
|
|
You can modify the program above to display the image in the correct orientation, by adding the line
|
|
```.cpp
|
|
// 5.1 invert y-axis, so image is oriented correctly
|
|
plot.getYAxis()->setInverted(true);
|
|
```
|
|
This will reorient the y-axis to point from top to bottom (for increasing positive coordinates):
|
|
|
|

|
|
|
|
|
|
|
|
See [`examples/rgbimageplot`](https://github.com/jkriege2/JKQtPlotter/tree/master/examples/rgbimageplot) for a detailed description of the other possibilities that the class JKQTPColumnRGBMathImage offer with respect to determining how an image is plotted.
|
|
|