5.5 KiB
Example (JKQTPlotter): Scatter-graph with custom symbols
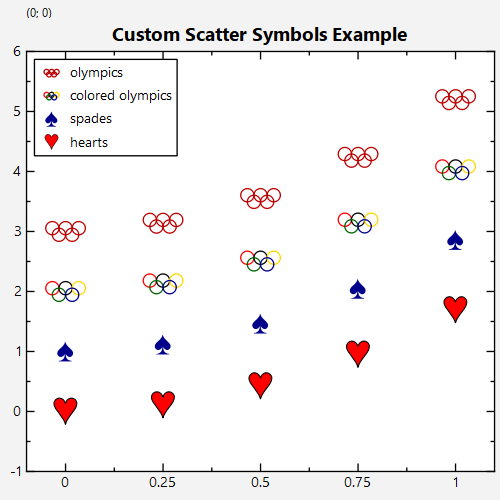
This project (see ./examples/scatter_customsymbol/) demonstrates using JKQTPlotter to draw a scatter graph (JKQTPXYScatterGraph) with custom symbols.
The source code of the example can be found in jkqtplotter_scatter.cpp.
First we create a plotter window and get a pointer to the internal datastore (for convenience):
    JKQTPlotter plot;
    JKQTPDatastore* ds=plot.getDatastore();
Now we add several columns to the JKQTPDatastore and obtain back-inserter iterators for these:
    size_t columnX=ds->addColumn("x");
    auto colXInserter=ds->backInserter(columnX);
    size_t columnY1=ds->addColumn("y1");
    auto colY1Inserter=ds->backInserter(columnY1);
    size_t columnY2=ds->addColumn("y2");
    auto colY2Inserter=ds->backInserter(columnY2);
    size_t columnY3=ds->addColumn("y3");
    auto colY3Inserter=ds->backInserter(columnY3);
    size_t columnY4=ds->addColumn("y4");
    auto colY4Inserter=ds->backInserter(columnY4);
... and fill the columns with data
    const int Ndata=5;
    for (int i=0; i<Ndata; i++) {
        // put data
        const double x=double(i)/double(Ndata-1);
        *(colXInserter++)=x;
        *(colY1Inserter++)=3.0+pow(x*1.3, 2.0)*1.3;
        *(colY2Inserter++)=2.0+pow(x*1.3, 2.0)*1.2;
        *(colY3Inserter++)=1.0+pow(x*1.3, 2.0)*1.1;
        *(colY4Inserter++)=pow(x*1.3, 2.0);
    }
Now we create several graph objects of type JKQTPXYScatterGraph. Each one uses a different custom symbol style:
Graphs graph3 and graph4 use JKQTPCharacterSymbol and JKQTPFilledCharacterSymbol respectively to draw spades and hearts from the unicode characters U+2660 and U+2665 respectively. The two graphs differ in the coloring of the symbols. The JKQTPCharacterSymbol variant would use the color default (cycling) graph color, but here we overwrite this with darkblue. The JKQTPFilledCharacterSymbol variant uses red filled hearts with a thin black border.
    JKQTPXYScatterGraph* graph3=new JKQTPXYScatterGraph(&plot);
    graph3->setXColumn(columnX);
    graph3->setYColumn(columnY3);
    graph3->setSymbolType(JKQTPCharacterSymbol+QChar(0x2660).unicode());
    graph3->setSymbolColor(QColor("darkblue"));
    graph3->setSymbolSize(15);
    graph3->setTitle(QObject::tr("spades"));
    plot.addGraph(graph3);

    JKQTPXYScatterGraph* graph4=new JKQTPXYScatterGraph(&plot);
    graph4->setXColumn(columnX);
    graph4->setYColumn(columnY4);
    graph4->setSymbolType(JKQTPFilledCharacterSymbol+QChar(0x2665).unicode());
    graph4->setSymbolSize(20);
    graph4->setSymbolColor(QColor("black"));
    graph4->setSymbolFillColor(QColor("red"));
    graph4->setSymbolLineWidth(0.5);
    graph4->setTitle(QObject::tr("hearts"));
    plot.addGraph(graph4);
The more advanced graphs graph1 and graph2 use JKQTPRegisterCustomGraphSymbol() to register functors that draw user-specific symbols:
    JKQTPCustomGraphSymbolFunctor f=[](QPainter& p) {
        p.setBrush(Qt::NoBrush); // ensure that circles are not drawn filled
        p.drawEllipse(QPointF(-0.33, -0.33/4.0), 0.33/2.0, 0.33/2.0);
        p.drawEllipse(QPointF(0, -0.33/4.0), 0.33/2.0, 0.33/2.0);
        p.drawEllipse(QPointF(0.33, -0.33/4.0), 0.33/2.0, 0.33/2.0);
        p.drawEllipse(QPointF(-0.33/2.0, 0.33/4.0), 0.33/2.0, 0.33/2.0);
        p.drawEllipse(QPointF(0.33/2.0, 0.33/4.0), 0.33/2.0, 0.33/2.0);
    };
    JKQTPGraphSymbols customsymbol_olympicrings=JKQTPRegisterCustomGraphSymbol(f);
    JKQTPXYScatterGraph* graph1=new JKQTPXYScatterGraph(&plot);
    graph1->setXColumn(columnX);
    graph1->setYColumn(columnY1);
    graph1->setSymbolType(customsymbol_olympicrings);
    graph1->setSymbolSize(30);
    graph1->setTitle(QObject::tr("olympics"));
    plot.addGraph(graph1);


    JKQTPGraphSymbols customsymbol_coloredolympicrings=JKQTPRegisterCustomGraphSymbol(
                [](QPainter& p) {
                        p.setBrush(Qt::NoBrush); // ensure that circles are not drawn filled
                        const double w=p.pen().widthF();
                        p.setPen(QPen(QColor("red"), w));
                        p.drawEllipse(QPointF(-0.33, -0.33/4.0), 0.33/2.0, 0.33/2.0);
                        p.setPen(QPen(QColor("black"), w));
                        p.drawEllipse(QPointF(0, -0.33/4.0), 0.33/2.0, 0.33/2.0);
                        p.setPen(QPen(QColor("gold"), w));
                        p.drawEllipse(QPointF(0.33, -0.33/4.0), 0.33/2.0, 0.33/2.0);
                        p.setPen(QPen(QColor("darkgreen"), w));
                        p.drawEllipse(QPointF(-0.33/2.0, 0.33/4.0), 0.33/2.0, 0.33/2.0);
                        p.setPen(QPen(QColor("darkblue"), w));
                        p.drawEllipse(QPointF(0.33/2.0, 0.33/4.0), 0.33/2.0, 0.33/2.0);
                    });
    JKQTPXYScatterGraph* graph2=new JKQTPXYScatterGraph(&plot);
    graph2->setXColumn(columnX);
    graph2->setYColumn(columnY2);
    graph2->setSymbolType(customsymbol_coloredolympicrings);
    graph2->setSymbolSize(30);
    graph2->setTitle(QObject::tr("colored olympics"));
    plot.addGraph(graph2);
Bothe variant show the olympic rings. graph1 uses the (cycling) default graph color and graph2 draws with user-defined colors.
The result looks like this:
