mirror of
https://github.com/jkriege2/JKQtPlotter.git
synced 2025-02-19 02:39:26 +08:00
- JKQTPGeoLine, JKQTPGeoPolyLines and JKQTPGeoInfiniteLine support decorators
- improved decorator drawing
- more decorator types
- improved example geometry
- added specific example geo_arrows
- improved documentation
- code cleanup
106 lines
22 KiB
Markdown
106 lines
22 KiB
Markdown
# Example (JKQTPlotter): Examples & Tutorials {#exampleProjectsTutorials}
|
|
This section assembles some simple examples of usage.
|
|
You can find more (complex) examples for the classes in this repository in the subfolder "test".
|
|
All test-projects are Qt-projects that use qmake to build. You can load them into QtCreator easily.
|
|
|
|
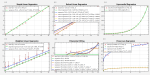
## Different Plot Data Styles
|
|
|
|
| Screenshot | Description | Notes |
|
|
|:-------------:| ------------- | ------------- |
|
|
| [](https://github.com/jkriege2/JKQtPlotter/tree/master/examples/simpletest/README.md) | [Very Basic Example (Line Graph)](https://github.com/jkriege2/JKQtPlotter/tree/master/examples/simpletest/README.md) | `JKQTPXYLineGraph` <br> C++-style QVector arrays of data |
|
|
| [](https://github.com/jkriege2/JKQtPlotter/tree/master/examples/speed) | [Line Graph with Live Data / Speed Test](https://github.com/jkriege2/JKQtPlotter/tree/master/examples/speed) | `JKQTPXYLineGraph` <br> external `std::array<double,N>` data, not owned by datastore <br> live-data, measure plotting speed <br> tipps to increas plotting speed |
|
|
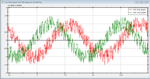
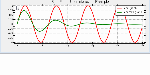
| [](https://github.com/jkriege2/JKQtPlotter/tree/master/examples/symbols_and_styles) | [Line Graph with Different Symbols and Line Styles](https://github.com/jkriege2/JKQtPlotter/tree/master/examples/symbols_and_styles) | `JKQTPXYLineGraph` <br> C++ vector of data <br> setting line styles and symbol styles <br> automatic graph coloring |
|
|
| [](https://github.com/jkriege2/JKQtPlotter/tree/master/examples/stepplots) | [Special Step Line Plots in Different Styles](https://github.com/jkriege2/JKQtPlotter/tree/master/examples/stepplots) | `JKQTPSpecialLineHorizontalGraph` <br> C++ vector of data <br> different step modes, filled and line-only |
|
|
| [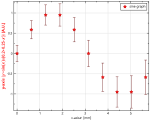](https://github.com/jkriege2/JKQtPlotter/tree/master/examples/symbols_and_errors) | [Simple Line/Symbol Graph With Errorbars](https://github.com/jkriege2/JKQtPlotter/tree/master/examples/symbols_and_errors) | `JKQTPXYLineErrorGraph` <br> C-style arrays of data |
|
|
| [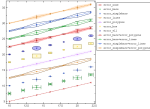](https://github.com/jkriege2/JKQtPlotter/tree/master/examples/errorbarstyles) | [Different Types of Error Indicators](https://github.com/jkriege2/JKQtPlotter/tree/master/examples/errorbarstyles) | `JKQTPXYLineErrorGraph` <br> different styles of error indicators for x- and y-errors <br> C++-style QVector for data <br> styling error indicators <br> moving key and formatting plotter grid |
|
|
| [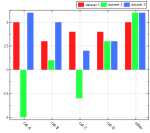](https://github.com/jkriege2/JKQtPlotter/tree/master/examples/barchart) | [Simple Bar Charts](https://github.com/jkriege2/JKQtPlotter/tree/master/examples/barchart) | `JKQTPBarVerticalGraph` <br> C-style arrays of data |
|
|
| [ <br> ](https://github.com/jkriege2/JKQtPlotter/tree/master/examples/stackedbars) | [Stacked Bar Charts](https://github.com/jkriege2/JKQtPlotter/tree/master/examples/stackedbars) | `JKQTPBarVerticalStackableGraph`, `JKQTPBarHorizontalStackableGraph` <br> C++-style vectors of data |
|
|
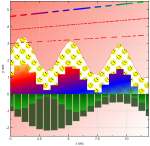
| [](https://github.com/jkriege2/JKQtPlotter/tree/master/examples/filledgraphs) | [Filled Curve Plots](https://github.com/jkriege2/JKQtPlotter/tree/master/examples/filledgraphs) | `JKQTPBarVerticalGraph` <br> setting/altering data in `JKQTPDatstore` directly <br> transparent plots <br> calculating histograms |
|
|
| [](https://github.com/jkriege2/JKQtPlotter/tree/master/examples/impulsesplot) | [Impulse Plots](https://github.com/jkriege2/JKQtPlotter/tree/master/examples/impulsesplot) | `JKQTPImpulsesVerticalGraph` and `JKQTPImpulsesHorizontalGraph` <br> C++-style QVector as plot data |
|
|
| [](https://github.com/jkriege2/JKQtPlotter/tree/master/examples/paramscatterplot) | [Scatter Graph with Parametrized Symbols/Colors](https://github.com/jkriege2/JKQtPlotter/tree/master/examples/paramscatterplot) | `JKQTPXYParametrizedScatterGraph` <br> C++-style QVector as plot data <br> modify scatter/points/line-graph properties by data |
|
|
| [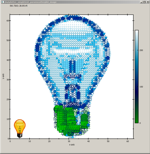](https://github.com/jkriege2/JKQtPlotter/tree/master/examples/paramscatterplot_image) | [Draw an Artistic Image with a Parametrized Scatter Graph](https://github.com/jkriege2/JKQtPlotter/tree/master/examples/paramscatterplot_image) | `JKQTPXYParametrizedScatterGraph` <br> C++-style QVector as plot data <br> rectangular arrangement of scatters <br> generative computer graphics |
|
|
| [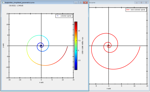](https://github.com/jkriege2/JKQtPlotter/tree/master/examples/parametriccurve) | [Plotting Parametric Curves](https://github.com/jkriege2/JKQtPlotter/tree/master/examples/parametriccurve) | `JKQTPXYLineGraph` and `JKQTPXYParametrizedScatterGraph` <br> C++-style QVector as plot data <br> parametric curve plotting |
|
|
| [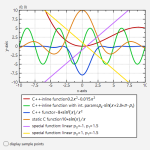](https://github.com/jkriege2/JKQtPlotter/tree/master/examples/functionplot) | [Plotting Mathematical Functions as Line Graphs](https://github.com/jkriege2/JKQtPlotter/tree/master/examples/functionplot) | `JKQTPXFunctionLineGraph` <br> diretly plotting C/C++-functions |
|
|
| [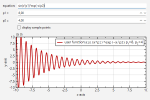](https://github.com/jkriege2/JKQtPlotter/tree/master/examples/parsedfunctionplot) | [Plotting Parsed Mathematical Functions as Line Graphs](https://github.com/jkriege2/JKQtPlotter/tree/master/examples/parsedfunctionplot) | `JKQTPXParsedFunctionLineGraph` <br> plotting functions with the internal math equation parser/evaluator |
|
|
| [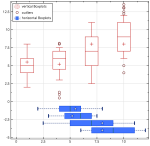](https://github.com/jkriege2/JKQtPlotter/tree/master/examples/boxplot) | [Plotting Box Plots](https://github.com/jkriege2/JKQtPlotter/tree/master/examples/boxplot) | `JKQTPBoxplotVerticalGraph`, `JKQTPBoxplotHorizontalGraph` |
|
|
| [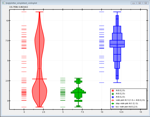](https://github.com/jkriege2/JKQtPlotter/tree/master/examples/violinplot) | [Plotting Violin Plots](https://github.com/jkriege2/JKQtPlotter/tree/master/examples/violinplot) | `JKQTPViolinplotVerticalElement`, `JKQTPViolinplotHorizontalElement` |
|
|
|
|
## Styling the Plot, Keys, Axes, ...
|
|
|
|
| Screenshot | Description | Notes |
|
|
|:-------------:| ------------- | ------------- |
|
|
| [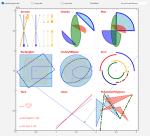](https://github.com/jkriege2/JKQtPlotter/tree/master/examples/geometric) | [Plotting Geometric Objects](https://github.com/jkriege2/JKQtPlotter/tree/master/examples/geometric) | |
|
|
| [](https://github.com/jkriege2/JKQtPlotter/tree/master/examples/geo_arrows) | [Plotting Arrows](https://github.com/jkriege2/JKQtPlotter/tree/master/examples/geo_arrows) | |
|
|
|
|
## Styling the Plot, Keys, Axes, ...
|
|
|
|
| Screenshot | Description | Notes |
|
|
|:-------------:| ------------- | ------------- |
|
|
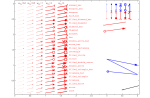
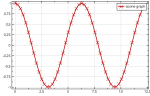
| [](https://github.com/jkriege2/JKQtPlotter/tree/master/examples/logaxes) | [logarithmic axes](https://github.com/jkriege2/JKQtPlotter/tree/master/examples/logaxes) | `JKQTPXYLineGraph` and `JKQTPGeoText` <br> C++ vector of data <br> logarithmic axes and styling <br> plot line styles <br> internal LaTeX parser <br> add commenting text to a graph |
|
|
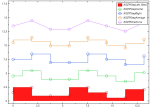
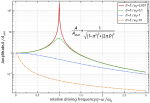
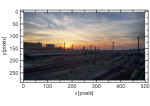
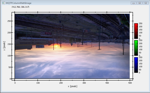
| [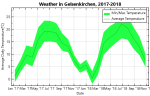 <br> 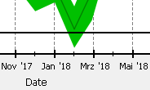 <br> 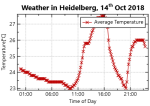](https://github.com/jkriege2/JKQtPlotter/tree/master/examples/dateaxes) | [date/time axes](https://github.com/jkriege2/JKQtPlotter/tree/master/examples/dateaxes) | `JKQTPXYLineGraph` and `JKQTPFilledVerticalRangeGraph` <br> C++ vector of data <br> date/time axes <br> plot min/max range graph <br> internal LaTeX parser <br> data from CSV files |
|
|
| [](https://github.com/jkriege2/JKQtPlotter/tree/master/examples/advplotstyling) | [advanced line and fill styling](https://github.com/jkriege2/JKQtPlotter/tree/master/examples/advplotstyling) | `JKQTPXYLineGraph`, `JKQTPSpecialLineHorizontalGraph` and `JKQTPBarVerticalGraph` <br> C++ vector of data <br> advanced line styling and filling |
|
|
| [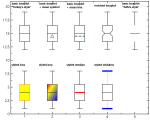](https://github.com/jkriege2/JKQtPlotter/tree/master/examples/styledboxplot) | [Styling of Boxplots](https://github.com/jkriege2/JKQtPlotter/tree/master/examples/styledboxplot) | Modifying different Aspects of the Styling of boxplots |
|
|
| [](https://github.com/jkriege2/JKQtPlotter/tree/master/examples/styling) | [Styling of JKQTPlotter](https://github.com/jkriege2/JKQtPlotter/tree/master/examples/styling) | Modifying different Aspects of the Styling of JKQTPlotter |
|
|
|
|
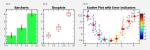
## Image data Plots
|
|
|
|
| Screenshot | Description | Notes |
|
|
|:-------------:| ------------- | ------------- |
|
|
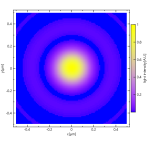
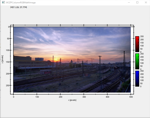
| [](https://github.com/jkriege2/JKQtPlotter/tree/master/examples/rgbimageplot_qt) | [`QImage` as a Graph](https://github.com/jkriege2/JKQtPlotter/tree/master/examples/rgbimageplot_qt) | `JKQTPImage` <br> `QImage` drawn onto a plot with arbitrary scaling <br> inverted coordinate axes |
|
|
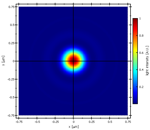
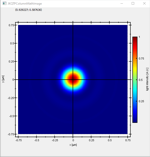
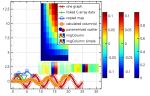
| [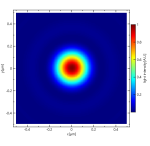](https://github.com/jkriege2/JKQtPlotter/tree/master/examples/imageplot) | [Basic 1-channel Raw C Image Plot](https://github.com/jkriege2/JKQtPlotter/tree/master/examples/imageplot) | `JKQTPColumnMathImage` <br> image data copied from C-style row-major array into a single column of the internal datastore <br> Describes several options of the image plotting classes (different ways of color coding, what to do with data above/below the limits etc.) |
|
|
| [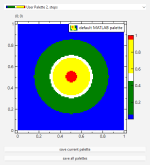](https://github.com/jkriege2/JKQtPlotter/tree/master/examples/imageplot_userpal) | [Image Plots with User-Defined Palettes](https://github.com/jkriege2/JKQtPlotter/tree/master/examples/imageplot_userpal) | `JKQTPColumnMathImage` <br> user-defines palettes <br> palettes from files |
|
|
| [](https://github.com/jkriege2/JKQtPlotter/tree/master/examples/imageplot_modifier) | [Modifier-Feature of Image Plots](https://github.com/jkriege2/JKQtPlotter/tree/master/examples/imageplot_modifier) | `JKQTPColumnMathImage` <br> image data copied from C-style row-major array into a single column of the internal datastore <br> Image is modified by a second image to display two data dimensions at the same time |
|
|
| [](https://github.com/jkriege2/JKQtPlotter/tree/master/examples/imageplot_nodatastore) | [Basic 1-channel Raw C Image Plot <br> without the internal datastore](https://github.com/jkriege2/JKQtPlotter/tree/master/examples/imageplot_nodatastore) | `JKQTPMathImage` <br> image data in a C-style row-major array, not using internal datastore |
|
|
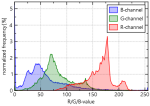
| [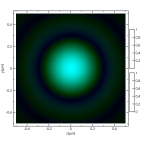](https://github.com/jkriege2/JKQtPlotter/tree/master/examples/rgbimageplot) | [Simple 3-channel Math RGB/CMY Image Plot](https://github.com/jkriege2/JKQtPlotter/tree/master/examples/rgbimageplot) | `JKQTPColumnRGBMathImage` <br> image data in a C-style row-major array, not using internal datastore <br> RGB/CMY color compositing |
|
|
| [](https://github.com/jkriege2/JKQtPlotter/tree/master/examples/imageplot_opencv) | [1-channel OpenCV cv::Mat Image Plot](https://github.com/jkriege2/JKQtPlotter/tree/master/examples/imageplot_opencv) | `JKQTPColumnMathImage` <br> image data copied from OpenCV cv::Mat-structure into a single column of the internal datastore |
|
|
| [](https://github.com/jkriege2/JKQtPlotter/tree/master/examples/rgbimageplot_opencv) | [RGB OpenCV cv::Mat Image Plot](https://github.com/jkriege2/JKQtPlotter/tree/master/examples/rgbimageplot_opencv) | `JKQTPColumnRGBMathImage` <br> image data copied from OpenCV cv::Mat-structure into three columns <br> inverted coordinate axesof the internal datastore |
|
|
| [](https://github.com/jkriege2/JKQtPlotter/tree/master/examples/imageplot_cimg) | [1-channel CImg Image Plot](https://github.com/jkriege2/JKQtPlotter/tree/master/examples/imageplot_cimg) | `JKQTPColumnMathImage` <br> image data copied from cimg CImg<T>-structure into a single column of the internal datastore |
|
|
| [](https://github.com/jkriege2/JKQtPlotter/tree/master/examples/rgbimageplot_cimg) | [RGB cimg Image Plot](https://github.com/jkriege2/JKQtPlotter/tree/master/examples/rgbimageplot_cimg) | `JKQTPColumnRGBMathImage` <br> image data copied from CImg image datastructure into three columns <br> inverted coordinate axesof the internal datastore |
|
|
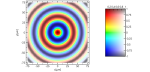
| [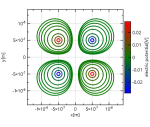](https://github.com/jkriege2/JKQtPlotter/tree/master/examples/contourplot) | [Contour Plots](https://github.com/jkriege2/JKQtPlotter/tree/master/examples/contourplot) | `JKQTPColumnContourPlot` <br> image data edited inside JKQTPDatastore |
|
|
|
|
|
|
|
|
## GUI Tools
|
|
|
|
| Screenshot | Description | Notes |
|
|
|:-------------:| ------------- | ------------- |
|
|
| [](https://github.com/jkriege2/JKQtPlotter/tree/master/examples/ui) | [Placing JKQTPlotter into a Qt User-Interface-XML-file (`*.ui`)](https://github.com/jkriege2/JKQtPlotter/tree/master/examples/ui) | using Qt Form Designer <br> parsed function plots (`JKQTPXParsedFunctionLineGraph`) |
|
|
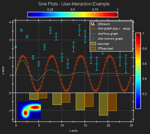
| [](https://github.com/jkriege2/JKQtPlotter/tree/master/examples/user_interaction) | [User Interaction](https://github.com/jkriege2/JKQtPlotter/tree/master/examples/user_interaction) | different possibilities of user-interaction in JKQtPlotter |
|
|
|
|
|
|
## Data Management & Statistics (Tutorials)
|
|
|
|
| Screenshot | Description | Notes |
|
|
|:-------------:| ------------- | ------------- |
|
|
| [](https://github.com/jkriege2/JKQtPlotter/tree/master/examples/datastore) | [Tutorial: Basic Usage of JKQTPDatastore](https://github.com/jkriege2/JKQtPlotter/tree/master/examples/datastore) | Basic Data Management with JKQTPDatastore <br/> Copying data into a JKQTPDatastore <br/> Editing data inside a JKQTPDatastore <br/> Editing Image Data in a JKQTPDatastore |
|
|
| [](https://github.com/jkriege2/JKQtPlotter/tree/master/examples/datastore_iterators) | [Tutorial: Iterator-based access to JKQTPDatastore](https://github.com/jkriege2/JKQtPlotter/tree/master/examples/datastore_iterators) | Iterator-based Data Management with JKQTPDatastore |
|
|
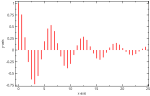
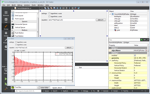
| [](https://github.com/jkriege2/JKQtPlotter/tree/master/examples/datastore_statistics) | [Tutorial: Advanced 1-Dimensional Statistics with JKQTPDatastore](https://github.com/jkriege2/JKQtPlotter/tree/master/examples/datastore_statistics) | Advanced 1-Dimensional Statistical Computation with JKQTPDatastore<br>using the internal statistics library<br>basic statistics (mean, standard deviation, ...)<br>boxplots<br>histograms<br>kernel density estimates (KDE) |
|
|
| [](https://github.com/jkriege2/JKQtPlotter/tree/master/examples/datastore_regression) | [Tutorial: Regression Analysis (with the Statistics Library)](https://github.com/jkriege2/JKQtPlotter/tree/master/examples/datastore_regression) | Advanced 1-Dimensional Statistical Computation with JKQTPDatastore<br>using the internal statistics library<br>Regression Analysis (with the Statistics Library)<br>robust regression (IRLS)<br>weighted regression<br>non-linear regression<br>polynomial fitting |
|
|
| [](https://github.com/jkriege2/JKQtPlotter/tree/master/examples/datastore_groupedstat) | [Tutorial: 1-Dimensional Group Statistics (with the Statistics Library)](https://github.com/jkriege2/JKQtPlotter/tree/master/examples/datastore_groupedstat) | Advanced 1-Dimensional Statistical Computation with JKQTPDatastore<br>grouped statistics<br>error indicators from data<br>boxplots |
|
|
| [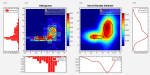](https://github.com/jkriege2/JKQtPlotter/tree/master/examples/datastore_statistics_2d) | [Tutorial: Advanced 2-Dimensional Statistics with JKQTPDatastore](https://github.com/jkriege2/JKQtPlotter/tree/master/examples/datastore_statistics_2d) | Advanced 2-Dimensional Statistical Computation with JKQTPDatastore<br>using the internal statistics library<br>histograms<br>kernel density estimates (KDE) |
|
|
|
|
|
|
## More Complex Examples
|
|
|
|
| Screenshot | Description | Notes |
|
|
|:-------------:| ------------- | ------------- |
|
|
| [](https://github.com/jkriege2/JKQtPlotter/tree/master/examples/multiplot) | [Layouting Several Plots](https://github.com/jkriege2/JKQtPlotter/tree/master/examples/multiplot) | Combining plots in Qt Layouts <br> linking plot axes <br> copy data from a `std::map` int the datastore <br> print plots/print preview |
|
|
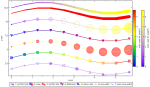
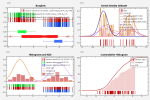
| [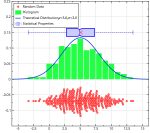](https://github.com/jkriege2/JKQtPlotter/tree/master/examples/distributionplot) | [Plotting a Statistical Distribution of Data](https://github.com/jkriege2/JKQtPlotter/tree/master/examples/distributionplot) | Combines several different graphs to draw random values, their distribution and some statistical properties |
|
|
|
|
|
|
|
|
## Tools and Special Features
|
|
|
|
| Screenshot | Description | Notes |
|
|
|:-------------:| ------------- | ------------- |
|
|
| [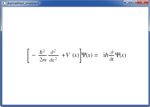](https://github.com/jkriege2/JKQtPlotter/tree/master/examples/jkqtmathtext_simpletest) | [JKQTMathText: Simple Demonstration](https://github.com/jkriege2/JKQtPlotter/tree/master/examples/jkqtmathtext_simpletest) | |
|
|
| [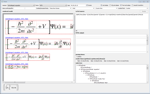](https://github.com/jkriege2/JKQtPlotter/tree/master/examples/jkqtmathtext_test) | [JKQTMathText: Full Testing Application](https://github.com/jkriege2/JKQtPlotter/tree/master/examples/jkqtmathtext_test) | |
|
|
| [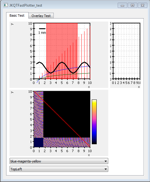](https://github.com/jkriege2/JKQtPlotter/tree/master/examples/jkqtfastplotter_test) | [JKQTFastPlotter: Example](https://github.com/jkriege2/JKQtPlotter/tree/master/examples/jkqtfastplotter_test) | |
|
|
|
|
|
|
## CMake Build System
|
|
|
|
| Screenshot | Description | Notes |
|
|
|:-------------:| ------------- | ------------- |
|
|
| [](https://github.com/jkriege2/JKQtPlotter/tree/master/examples/simpletest/README.md) | [CMake Example Linking Against JKQTPlotter](https://github.com/jkriege2/JKQtPlotter/tree/master/examples/cmake_link_example) | explains how to link against JKQTPlotter with CMake |
|