mirror of
https://github.com/jkriege2/JKQtPlotter.git
synced 2024-12-26 10:31:39 +08:00
151 lines
7.4 KiB
Markdown
151 lines
7.4 KiB
Markdown
# Example (JKQTPlotter): Plotting a Statistical Distribution of Data {#JKQTPlotterDistributionPlot}
|
|
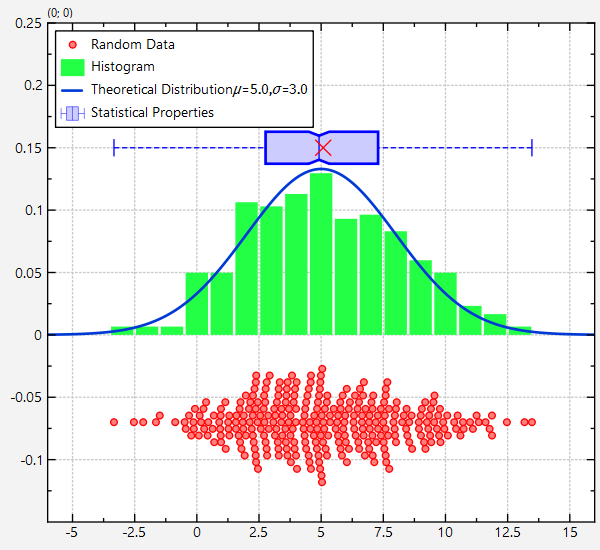
This project (see [`test_distributionplot`](https://github.com/jkriege2/JKQtPlotter/tree/master/examples/test_distributionplot) demonstrates how to combine several different graphs and geometric elements to show a set of random values and their statistics.
|
|
|
|
|
|
[JKQTPlotterBasicJKQTPDatastore]: @ref JKQTPlotterBasicJKQTPDatastore "Basic Usage of JKQTPDatastore"
|
|
[JKQTPlotterBasicJKQTPDatastoreIterators]: @ref JKQTPlotterBasicJKQTPDatastoreIterators "Iterator-Based usage of JKQTPDatastore"
|
|
[JKQTPlotterBasicJKQTPDatastoreStatistics]: @ref JKQTPlotterBasicJKQTPDatastoreStatistics "Advanced 1-Dimensional Statistics with JKQTPDatastore"
|
|
[JKQTPlotterBasicJKQTPDatastoreRegression]: @ref JKQTPlotterBasicJKQTPDatastoreRegression "Regression Analysis (with the Statistics Library)"
|
|
[JKQTPlotterBasicJKQTPDatastoreStatistics2D]: @ref JKQTPlotterBasicJKQTPDatastoreStatistics2D "Advanced 2-Dimensional Statistics with JKQTPDatastore"
|
|
[statisticslibrary]: @ref jkqtptools_math_statistics "JKQTPlotter Statistics Library"
|
|
[JKQTPlotterBoxplotStyling]: @ref JKQTPlotterBoxplotStyling "Styling different aspects of boxplots"
|
|
[JKQTPlotterBoxplotsGraphs]: @ref JKQTPlotterBoxplotsGraphs "Boxplots"
|
|
|
|
***Note*** that this example explains how to generate the statistics plots by hand, i.e. by calculating all the statistical properties for the boxplots and then adding the necessary graphs. The internal [statisticslibrary] offers methods to perform these calculations, which are explained in the tutorial [JKQTPlotterBasicJKQTPDatastoreStatistics] in detail. Several examples give more details on boxplots: [JKQTPlotterBoxplotsGraphs], [JKQTPlotterBoxplotStyling].
|
|
|
|
|
|
The source code of the main application is (see [`test_distributionplot.cpp`](test_distributionplot.cpp).
|
|
|
|
After adding all necessary data to the JKQTDatastore:
|
|
```.cpp
|
|
// 1. create a plotter window and get a pointer to the internal datastore (for convenience)
|
|
JKQTPlotter plot;
|
|
plot.getPlotter()->setUseAntiAliasingForGraphs(true); // nicer (but slower) plotting
|
|
plot.getPlotter()->setUseAntiAliasingForSystem(true); // nicer (but slower) plotting
|
|
plot.getPlotter()->setUseAntiAliasingForText(true); // nicer (but slower) text rendering
|
|
JKQTPDatastore* ds=plot.getDatastore();
|
|
|
|
// 2. now we create random values drawn from a gaussian distribution
|
|
QVector<double> RANDVAL; // will store the values themselves
|
|
std::map<int, double> hist; // is used to calculate the histogram of the data
|
|
for (int i=-5; i<=15; i++) hist[i]=0;
|
|
|
|
std::random_device rd; // random number generators:
|
|
std::mt19937 gen{rd()};
|
|
|
|
// draw 301 random values from a gaussian distribution around 5 with width 3
|
|
const double th_mean=5;
|
|
const double th_std=3;
|
|
std::normal_distribution<> d{th_mean,th_std};
|
|
size_t NDATA=301;
|
|
double sum=0;
|
|
double square_sum=0;
|
|
for (size_t i=0; i<NDATA; i++) {
|
|
const double v=d(gen);
|
|
RANDVAL<<v; // store data
|
|
++hist[std::round(v)]; // calculate histogram
|
|
// accumulate data for statistics:
|
|
sum+=v;
|
|
square_sum+=(v*v);
|
|
}
|
|
// normalize histogram
|
|
for (auto& hi: hist) {
|
|
hi.second=hi.second/static_cast<double>(NDATA);
|
|
}
|
|
// sort random data in order to calculate the statistical properties:
|
|
qSort(RANDVAL);
|
|
const double rndMean=sum/static_cast<double>(NDATA);
|
|
const double rndMin=RANDVAL.first();
|
|
const double rndMax=RANDVAL.last();
|
|
const double rndMedian=RANDVAL[RANDVAL.size()/2];
|
|
const double rndQ25=RANDVAL[RANDVAL.size()/4];
|
|
const double rndQ75=RANDVAL[RANDVAL.size()*3/4];
|
|
const double rndMedianConfidence=2.0*1.57*fabs(rndQ75-rndQ25)/sqrt(static_cast<double>(NDATA));
|
|
|
|
// 3. make data available to JKQTPlotter by adding it to the internal datastore.
|
|
size_t columnRANDVAL=ds->addCopiedColumn(RANDVAL, "RANDVAL"); // copy random values
|
|
std::pair<size_t,size_t> columnHIST = ds->addCopiedMap(hist, "HIST_X", "HIST_Y"); // copy histogram
|
|
|
|
|
|
// 4. create a graph of horizontal boxplots:
|
|
JKQTPSingleColumnSymbolsGraph* graphRANDVALS=new JKQTPSingleColumnSymbolsGraph(&plot);
|
|
graphRANDVALS->setDataColumn(columnRANDVAL);
|
|
// draw data as symbols at (x,y)=(data,-0.07):
|
|
graphRANDVALS->setDataDirection(JKQTPSingleColumnSymbolsGraph::DataDirection::X);
|
|
graphRANDVALS->setPosition(-0.07);
|
|
// data should scatter around position=-0.07 with a width=0.08 (i.e. from position-width/2 ... position+width/2)
|
|
//graphRANDVALS->setWidth(0.08);
|
|
//graphRANDVALS->setPositionScatterStyle(JKQTPSingleColumnSymbolsGraph::RandomScatter);
|
|
// data should scatter around position=-0.07 in a BeeSwarmScatter-Plot
|
|
graphRANDVALS->setPositionScatterStyle(JKQTPSingleColumnSymbolsGraph::BeeSwarmScatter);
|
|
// choose small filled circles as symbols, JKQTPGraphSymbols::set their color:
|
|
graphRANDVALS->setSymbolType(JKQTPFilledCircle);
|
|
graphRANDVALS->setSymbolSize(5);
|
|
graphRANDVALS->setColor(QColor("red"));
|
|
graphRANDVALS->setFillColor(graphRANDVALS->getColor().lighter(180));
|
|
// set title:
|
|
graphRANDVALS->setTitle("Random Data");
|
|
|
|
|
|
// 5. draw the histogram as barchart:
|
|
JKQTPBarVerticalGraph* graphHIST=new JKQTPBarVerticalGraph(&plot);
|
|
graphHIST->setXColumn(columnHIST.first);
|
|
graphHIST->setYColumn(columnHIST.second);
|
|
// set title:
|
|
graphHIST->setTitle("Histogram");
|
|
|
|
|
|
// 6. draw the theoretical distribution as function graph:
|
|
JKQTPXFunctionLineGraph* graphTheoDist=new JKQTPXFunctionLineGraph(&plot);
|
|
// define the gaussian function used for the random number generator
|
|
graphTheoDist->setPlotFunctionFunctor([&th_mean,&th_std](double x) -> double {
|
|
return 1.0/(th_std*sqrt(2.0*M_PI))*exp(-0.5*(x-th_mean)*(x-th_mean)/th_std/th_std);
|
|
});
|
|
// set title:
|
|
graphTheoDist->setTitle(QString("Theoretical Distribution $\\mu=%1, \\sigma=%2$").arg(th_mean,0, 'f', 1).arg(th_std,0, 'f', 1));
|
|
|
|
|
|
|
|
// 7. create a graph of horizontal boxplots:
|
|
JKQTPBoxplotHorizontalElement* graphBoxPlot=new JKQTPBoxplotHorizontalElement(&plot);
|
|
graphBoxPlot->setPos(0.15);
|
|
graphBoxPlot->setMin(rndMin);
|
|
graphBoxPlot->setPercentile25(rndQ25);
|
|
graphBoxPlot->setMean(rndMean);
|
|
graphBoxPlot->setMedian(rndMedian);
|
|
graphBoxPlot->setMedianConfidenceIntervalWidth(rndMedianConfidence);
|
|
graphBoxPlot->setPercentile75(rndQ75);
|
|
graphBoxPlot->setMax(rndMax);
|
|
graphBoxPlot->setBoxWidthAbsolute(24);
|
|
graphBoxPlot->setMeanSize(16);
|
|
graphBoxPlot->setLineWidth(2);
|
|
graphBoxPlot->setTitle("Statistical Properties");
|
|
graphBoxPlot->setBoxplotColor(QColor("blue"), plot.getPlotter());
|
|
// make fill collor a lighter shade of the outline color
|
|
graphBoxPlot->setFillColor(graphBoxPlot->getLineColor().lighter(180));
|
|
// make whiskers dashed
|
|
graphBoxPlot->setWhiskerLineStyle(Qt::DashLine);
|
|
|
|
|
|
// 8. add the graphs to the plot, so it is actually displayed
|
|
plot.addGraph(graphRANDVALS);
|
|
plot.addGraph(graphHIST);
|
|
plot.addGraph(graphTheoDist);
|
|
plot.addGraph(graphBoxPlot);
|
|
|
|
|
|
// 9. autoscale the plot so the graph is contained
|
|
plot.zoomToFit();
|
|
|
|
// 10. Move key to top-left
|
|
plot.getPlotter()->setKeyPosition(JKQTPKeyInsideTopLeft);
|
|
|
|
// 11. show plotter and make it a decent size
|
|
plot.show();
|
|
plot.resize(800,800);
|
|
```
|
|
|
|
The result looks like this:
|
|
|
|

|