..
contextmenu_graph_visibility.png
added speed-test
2018-12-02 18:30:29 +01:00
examplesbanner.png
added missing documentation images
2019-01-12 14:08:32 +01:00
jkqtmathtext_simpletest_small.png
reformated examples markdown-pages
2018-11-26 22:35:21 +01:00
jkqtmathtext_simpletest.png
added simple JKQTmathText example
2015-08-02 15:42:09 +02:00
jkqtmathtext_testapp_small.png
- added new graph: JKQTPSingleColumnSymbolsGraph
2019-01-20 16:15:10 +01:00
jkqtmathtext_testapp.png
- added new graph: JKQTPSingleColumnSymbolsGraph
2019-01-20 16:15:10 +01:00
JKQTPbarHorizontalGraphStacked_small.png
reformated examples markdown-pages
2018-11-26 22:35:21 +01:00
JKQTPbarVerticalGraphStacked_small.png
reformated examples markdown-pages
2018-11-26 22:35:21 +01:00
jkqtplotter_simpletest1_small.png
reformated examples markdown-pages
2018-11-26 22:35:21 +01:00
jkqtplotter_simpletest1.png
* improved class interface
2015-08-02 13:36:54 +02:00
jkqtplotter_simpletest_barchart_small.png
reformated examples markdown-pages
2018-11-26 22:35:21 +01:00
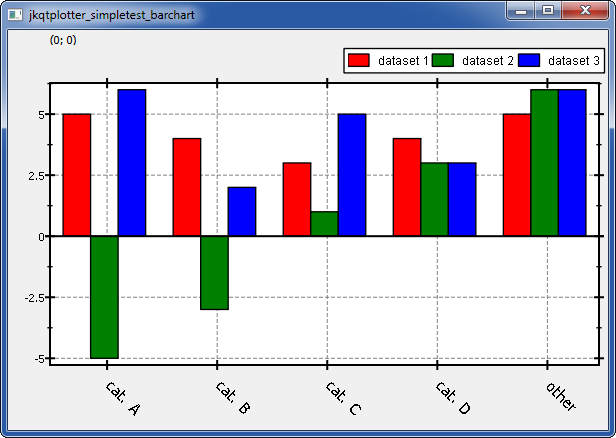
jkqtplotter_simpletest_barchart.png
added barchart example (+minor improvements)
2015-08-02 15:04:37 +02:00
jkqtplotter_simpletest_boxplot_small.png
- added new graph: JKQTPSingleColumnSymbolsGraph
2019-01-20 16:15:10 +01:00
jkqtplotter_simpletest_boxplot.png
- added new graph: JKQTPSingleColumnSymbolsGraph
2019-01-20 16:15:10 +01:00
jkqtplotter_simpletest_dateaxes_dates_small.png
improved main page
2018-12-01 16:08:33 +01:00
jkqtplotter_simpletest_dateaxes_small.png
added y-range-plot JKQTPfilledVerticalRangeGraph and example for it + date/time axes
2018-12-01 16:02:04 +01:00
jkqtplotter_simpletest_dateaxes_timeaxis_small.png
improved main page
2018-12-01 16:06:32 +01:00
jkqtplotter_simpletest_dateaxes_timeaxis.png
added y-range-plot JKQTPfilledVerticalRangeGraph and example for it + date/time axes
2018-12-01 16:02:04 +01:00
jkqtplotter_simpletest_dateaxes.png
added y-range-plot JKQTPfilledVerticalRangeGraph and example for it + date/time axes
2018-12-01 16:02:04 +01:00
jkqtplotter_simpletest_errorbarstyles_barcharts.png
added example project for error indicator styles
2018-12-02 11:38:27 +01:00
jkqtplotter_simpletest_errorbarstyles_filledcurves.png
added example project for error indicator styles
2018-12-02 11:38:27 +01:00
jkqtplotter_simpletest_errorbarstyles_impulses.png
added example project for error indicator styles
2018-12-02 11:38:27 +01:00
jkqtplotter_simpletest_errorbarstyles_small.png
added example project for error indicator styles
2018-12-02 11:38:27 +01:00
jkqtplotter_simpletest_errorbarstyles.png
added example project for error indicator styles
2018-12-02 11:38:27 +01:00
jkqtplotter_simpletest_filledgraphs_small.png
improved data-access via JKQTPcolumn
2018-12-10 23:57:20 +01:00
jkqtplotter_simpletest_filledgraphs_yaxis.png
bugfix in JKQTPfilledCurveYGraph and example for JKQTPfilledCurveYGraph
2018-12-11 00:05:21 +01:00
jkqtplotter_simpletest_filledgraphs.png
improved data-access via JKQTPcolumn
2018-12-10 23:57:20 +01:00
jkqtplotter_simpletest_functionplot_fy.png
tidied up code of parsed function graphs, added f(y) parsed function class (JKQTPyParsedFunctionLineGraph), improved examples
2018-12-24 15:07:14 +01:00
jkqtplotter_simpletest_functionplot_small.png
improved parsed/evaluated function classes (made C++11-ready) and added examples for them
2018-12-23 20:27:24 +01:00
jkqtplotter_simpletest_functionplot.png
tidied up code of parsed function graphs, added f(y) parsed function class (JKQTPyParsedFunctionLineGraph), improved examples
2018-12-24 15:07:14 +01:00
jkqtplotter_simpletest_geometric_small.png
added example for geometric objects
2019-01-07 21:00:56 +01:00
jkqtplotter_simpletest_geometric.png
added example for geometric objects
2019-01-07 21:00:56 +01:00
jkqtplotter_simpletest_imageplot__scale02.png
added more examples and explanations for image plots, fixed some bugs in large example/test
2018-11-28 23:10:14 +01:00
jkqtplotter_simpletest_imageplot__smallscalecolor.png
added more examples and explanations for image plots, fixed some bugs in large example/test
2018-11-28 23:10:14 +01:00
jkqtplotter_simpletest_imageplot__smallscalelimitcolor.png
added more examples and explanations for image plots, fixed some bugs in large example/test
2018-11-28 23:10:14 +01:00
jkqtplotter_simpletest_imageplot__smallscaletransparent.png
added more examples and explanations for image plots, fixed some bugs in large example/test
2018-11-28 23:10:14 +01:00
jkqtplotter_simpletest_imageplot_modifier_imageonly.png
added more examples and explanations for image plots, fixed some bugs in large example/test
2018-11-28 23:10:14 +01:00
jkqtplotter_simpletest_imageplot_modifier_modifieronly.png
added more examples and explanations for image plots, fixed some bugs in large example/test
2018-11-28 23:10:14 +01:00
jkqtplotter_simpletest_imageplot_modifier_small.png
- more refactorings to modernize C++
2019-01-26 18:00:42 +01:00
jkqtplotter_simpletest_imageplot_modifier.png
- more refactorings to modernize C++
2019-01-26 18:00:42 +01:00
jkqtplotter_simpletest_imageplot_nodatastore_small.png
added more examples and explanations for image plots, fixed some bugs in large example/test
2018-11-28 23:10:14 +01:00
jkqtplotter_simpletest_imageplot_nodatastore.png
added more examples and explanations for image plots, fixed some bugs in large example/test
2018-11-28 23:10:14 +01:00
jkqtplotter_simpletest_imageplot_opencv_small.png
added OpenCV-support
2018-11-26 22:14:41 +01:00
jkqtplotter_simpletest_imageplot_opencv.png
added OpenCV-support
2018-11-26 22:14:41 +01:00
jkqtplotter_simpletest_imageplot_small.png
reformated examples markdown-pages
2018-11-26 22:35:21 +01:00
jkqtplotter_simpletest_imageplot.png
added example for MathImagePLot
2018-11-25 21:09:31 +01:00
jkqtplotter_simpletest_impulsesplot_horizontal.png
renamed impulse plot classes, so the names actually make sense
2018-12-11 23:00:43 +01:00
jkqtplotter_simpletest_impulsesplot_small.png
renamed impulse plot classes, so the names actually make sense
2018-12-11 23:00:43 +01:00
jkqtplotter_simpletest_impulsesplot.png
renamed impulse plot classes, so the names actually make sense
2018-12-11 23:00:43 +01:00
jkqtplotter_simpletest_logaxes_highqmathrendering.png
improved log-axis-example
2018-12-03 23:09:12 +01:00
jkqtplotter_simpletest_logaxes_lowqmathrendering.png
improved log-axis-example
2018-12-03 23:09:12 +01:00
jkqtplotter_simpletest_logaxes_nolog.png
added example for log axes
2018-11-29 22:48:31 +01:00
jkqtplotter_simpletest_logaxes_nominorgrid.png
improved log-axis-example
2018-12-03 23:09:12 +01:00
jkqtplotter_simpletest_logaxes_small.png
added example for log axes
2018-11-29 22:48:31 +01:00
jkqtplotter_simpletest_logaxes.png
improved log-axis-example
2018-12-03 23:09:12 +01:00
jkqtplotter_simpletest_parametriccurve1.png
added example that shows how to draw parametric curves
2018-12-16 15:35:50 +01:00
jkqtplotter_simpletest_parametriccurve2.png
added example that shows how to draw parametric curves
2018-12-16 15:35:50 +01:00
jkqtplotter_simpletest_parametriccurve_small.png
added example that shows how to draw parametric curves
2018-12-16 15:35:50 +01:00
jkqtplotter_simpletest_paramscatterplot_datatable.png
added simple example for JKQTPxyParametrizedScatterGraph
2018-12-16 15:00:19 +01:00
jkqtplotter_simpletest_paramscatterplot_image_palette_triangle.png
add example for pointilistic image plot, using a scatter plot
2018-12-24 21:39:37 +01:00
jkqtplotter_simpletest_paramscatterplot_image_palette.png
add example for pointilistic image plot, using a scatter plot
2018-12-24 21:39:37 +01:00
jkqtplotter_simpletest_paramscatterplot_image_small.png
add example for pointilistic image plot, using a scatter plot
2018-12-24 21:39:37 +01:00
jkqtplotter_simpletest_paramscatterplot_image_star.png
add example for pointilistic image plot, using a scatter plot
2018-12-24 21:39:37 +01:00
jkqtplotter_simpletest_paramscatterplot_image_varsymbol.png
add example for pointilistic image plot, using a scatter plot
2018-12-24 21:39:37 +01:00
jkqtplotter_simpletest_paramscatterplot_image.png
add example for pointilistic image plot, using a scatter plot
2018-12-24 21:39:37 +01:00
jkqtplotter_simpletest_paramscatterplot_small.png
added simple example for JKQTPxyParametrizedScatterGraph
2018-12-16 15:00:19 +01:00
jkqtplotter_simpletest_paramscatterplot.png
added simple example for JKQTPxyParametrizedScatterGraph
2018-12-16 15:00:19 +01:00
jkqtplotter_simpletest_parsedfunctionplot_2overx_samplepoints.png
JKQTPxFunctionLineGraph and JKQTPyFunctionLineGraph now allow for simplified functions without parameters + improved handling of special functions, improved example for parsed functions (with possibility to display sample points
2018-12-24 12:29:33 +01:00
jkqtplotter_simpletest_parsedfunctionplot_2overx.png
improved parsed/evaluated function classes (made C++11-ready) and added examples for them
2018-12-23 20:27:24 +01:00
jkqtplotter_simpletest_parsedfunctionplot_fy.png
tidied up code of parsed function graphs, added f(y) parsed function class (JKQTPyParsedFunctionLineGraph), improved examples
2018-12-24 15:07:14 +01:00
jkqtplotter_simpletest_parsedfunctionplot_small.png
improved parsed/evaluated function classes (made C++11-ready) and added examples for them
2018-12-23 20:27:24 +01:00
jkqtplotter_simpletest_parsedfunctionplot.png
improved parsed/evaluated function classes (made C++11-ready) and added examples for them
2018-12-23 20:27:24 +01:00
jkqtplotter_simpletest_rgbimageplot_opencv_small.png
added RGB image plot example/test
2018-11-27 22:49:27 +01:00
jkqtplotter_simpletest_rgbimageplot_opencv.png
added RGB image plot example/test
2018-11-27 22:49:27 +01:00
jkqtplotter_simpletest_rgbimageplot_qt_small.png
improvements to JKQTPImage, which may now also own an image and can receive a copy to this internally owned object from an external instance
2018-12-06 18:19:02 +01:00
jkqtplotter_simpletest_rgbimageplot_qt.png
improvements to JKQTPImage, which may now also own an image and can receive a copy to this internally owned object from an external instance
2018-12-06 18:19:02 +01:00
jkqtplotter_simpletest_speed_small.png
added speed-test
2018-12-02 18:30:29 +01:00
jkqtplotter_simpletest_speed.png
added speed-test
2018-12-02 18:30:29 +01:00
jkqtplotter_simpletest_stepplots_small.png
improved step plots (JKQTPstepHorizontalGraph, JKQTPstepVerticalGraph) with 3 step-modes (left/center/right), instead of only two (right/center)
2018-12-06 21:41:35 +01:00
jkqtplotter_simpletest_stepplots.png
improved step plots (JKQTPstepHorizontalGraph, JKQTPstepVerticalGraph) with 3 step-modes (left/center/right), instead of only two (right/center)
2018-12-06 21:41:35 +01:00
jkqtplotter_simpletest_symbols_and_errors_small.png
reformated examples markdown-pages
2018-11-26 22:35:21 +01:00
jkqtplotter_simpletest_symbols_and_errors.png
added new, but simple example
2015-08-02 14:10:55 +02:00
jkqtplotter_simpletest_symbols_and_styles_small.png
some renames and new example for line styles and symbols
2018-11-29 21:57:35 +01:00
jkqtplotter_simpletest_symbols_and_styles.png
modified example a bit
2018-11-29 22:06:58 +01:00
jkqtplotter_simpletest_ui_loglog.png
added example that explains how to use JKQtPlotter from the Qt Form Designer
2019-01-08 20:02:05 +01:00
jkqtplotter_simpletest_ui_small.png
added example that explains how to use JKQtPlotter from the Qt Form Designer
2019-01-08 20:02:05 +01:00
jkqtplotter_simpletest_ui_widget.png
added example that explains how to use JKQtPlotter from the Qt Form Designer
2019-01-08 20:02:05 +01:00
jkqtplotter_simpletest_ui.png
added example that explains how to use JKQtPlotter from the Qt Form Designer
2019-01-08 20:02:05 +01:00
logaxis_set_labelType.png
improved log-axis-example
2018-12-03 23:09:12 +01:00
logaxis_set_minorticks.png
improved log-axis-example
2018-12-03 23:09:12 +01:00
mscreen_cauchy.png
w
2015-07-11 18:06:49 +02:00
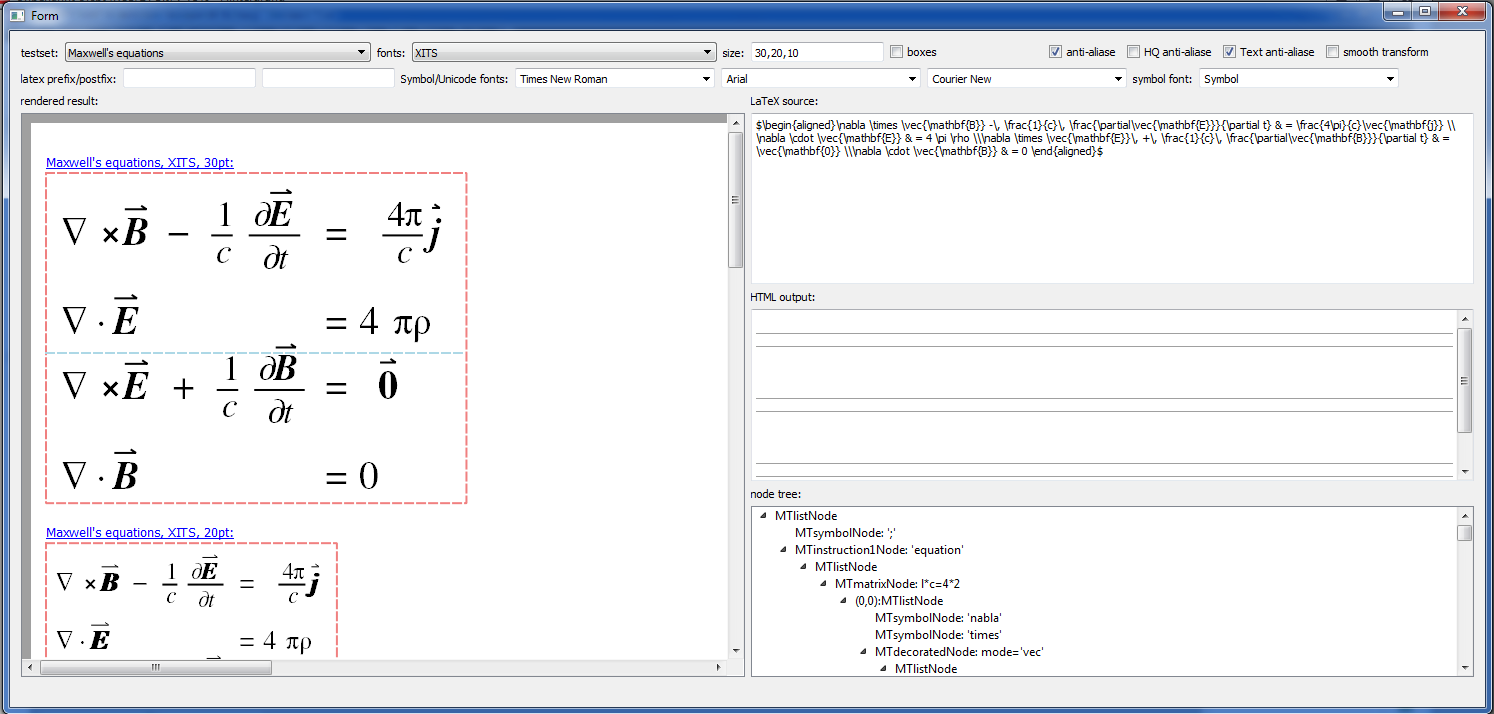
mscreen_maxwell.png
w
2015-07-11 18:06:49 +02:00
mscreen_rottaion.png
w
2015-07-11 18:06:49 +02:00
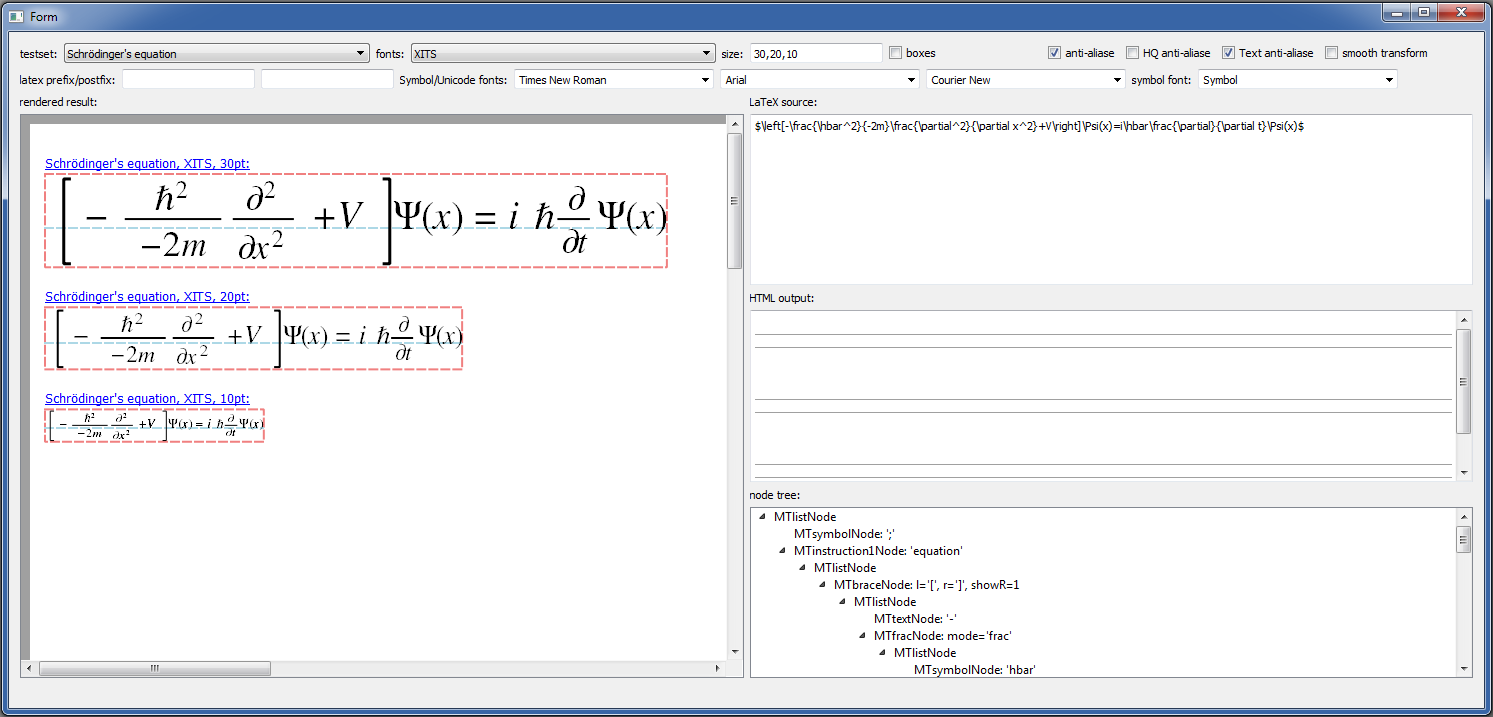
mscreen_schroedinger.png
w
2015-07-11 18:06:49 +02:00
mscreen_sd.png
w
2015-07-11 18:06:49 +02:00
plot_boxplothorizontalelement.png
- added new graph: JKQTPSingleColumnSymbolsGraph
2019-01-20 16:15:10 +01:00
plot_boxplotverticalelement.png
- added new graph: JKQTPSingleColumnSymbolsGraph
2019-01-20 16:15:10 +01:00
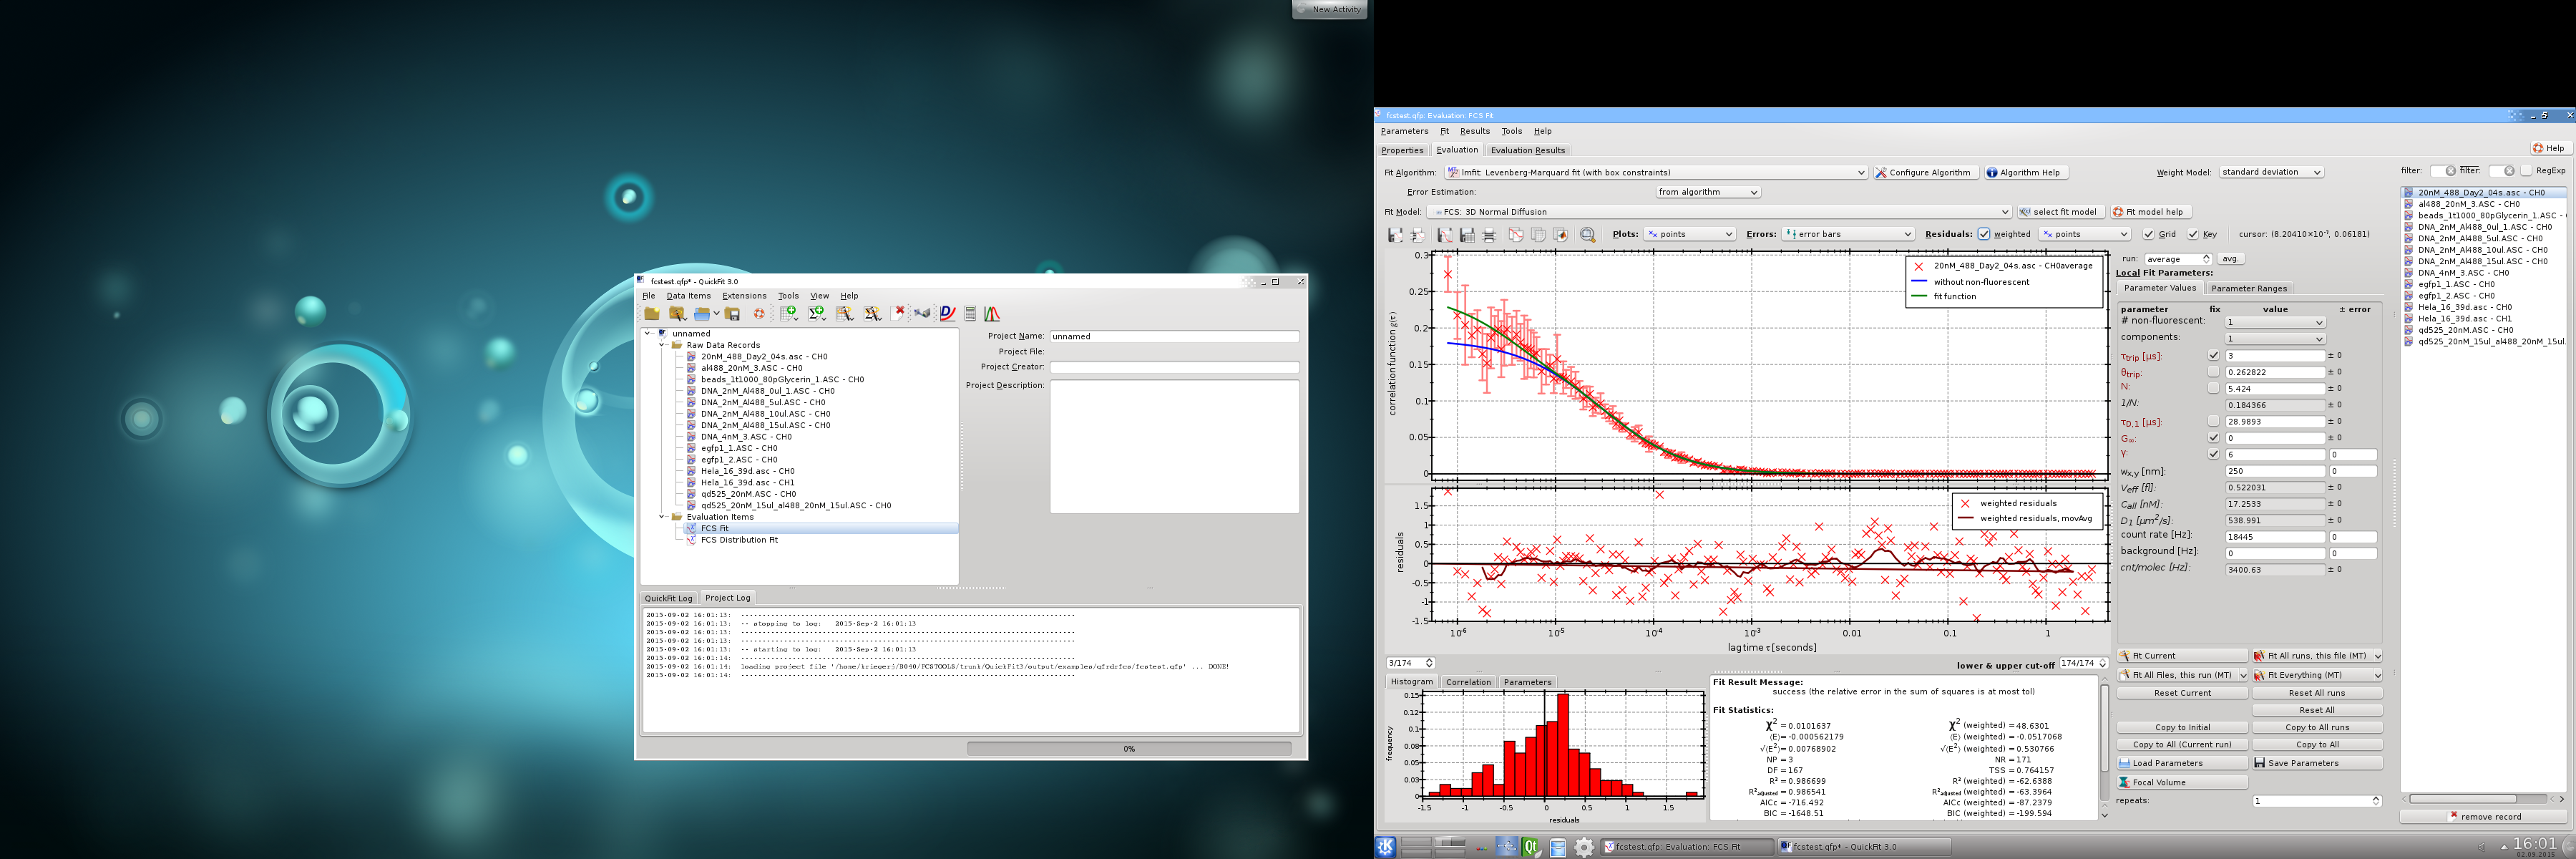
QF3_linux_screen_fcsfit.png
added QuickFit3 screenshots
2019-01-12 14:21:18 +01:00
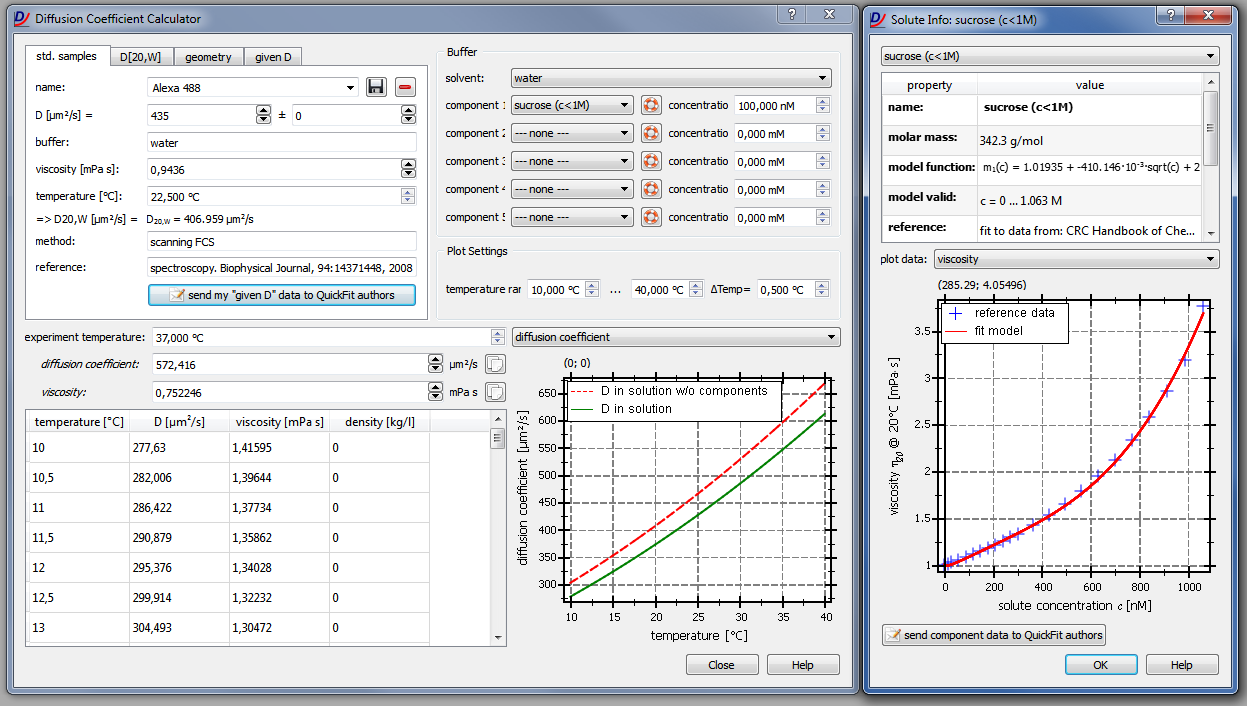
QF3_screen_dcalc.png
added QuickFit3 screenshots
2019-01-12 14:21:18 +01:00
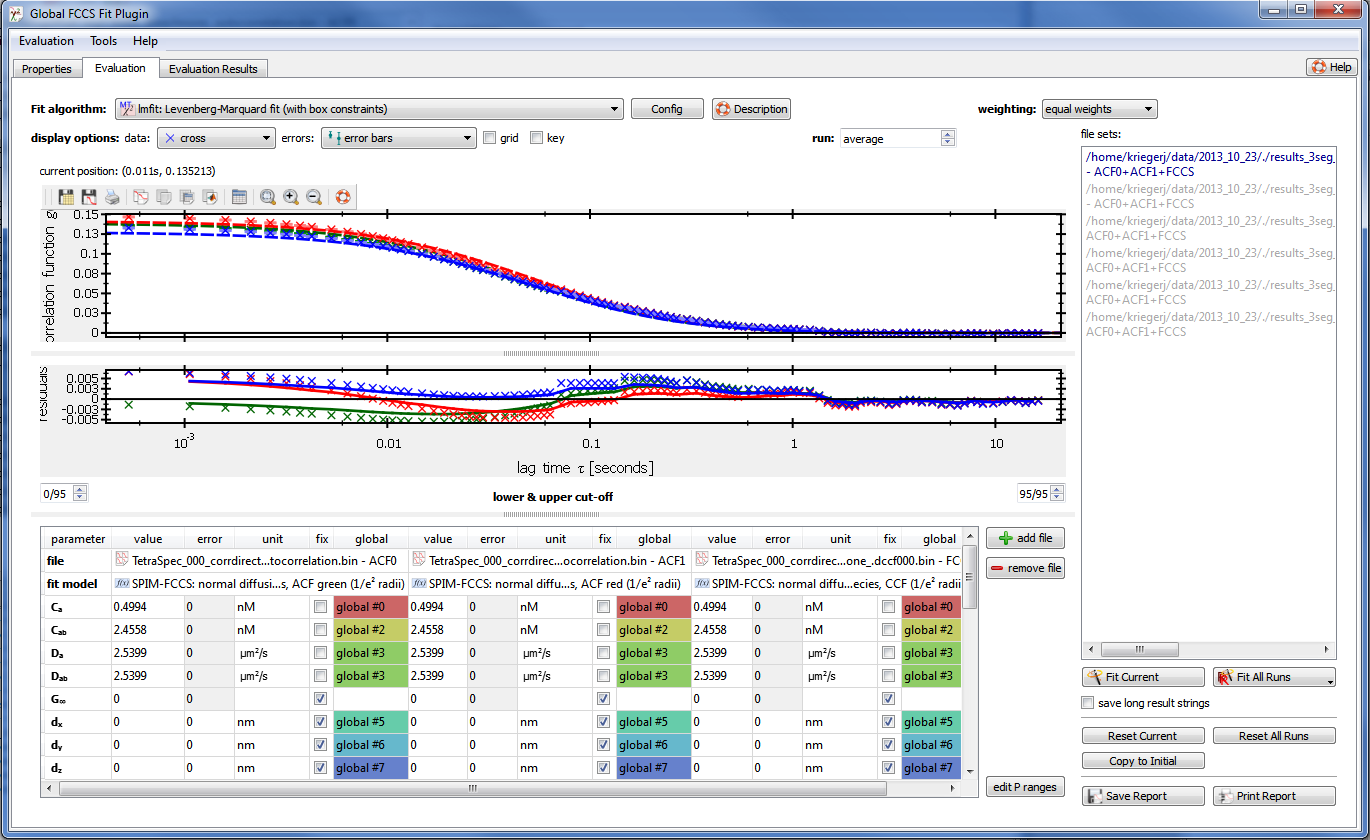
QF3_screen_fccsfit.png
added QuickFit3 screenshots
2019-01-12 14:21:18 +01:00
QF3_screen_fcsfit.png
added QuickFit3 screenshots
2019-01-12 14:21:18 +01:00
QF3_screen_imfccsfit.png
added QuickFit3 screenshots
2019-01-12 14:21:18 +01:00
QF3_screen_imfcs_paramcorrelation.png
added QuickFit3 screenshots
2019-01-12 14:21:18 +01:00
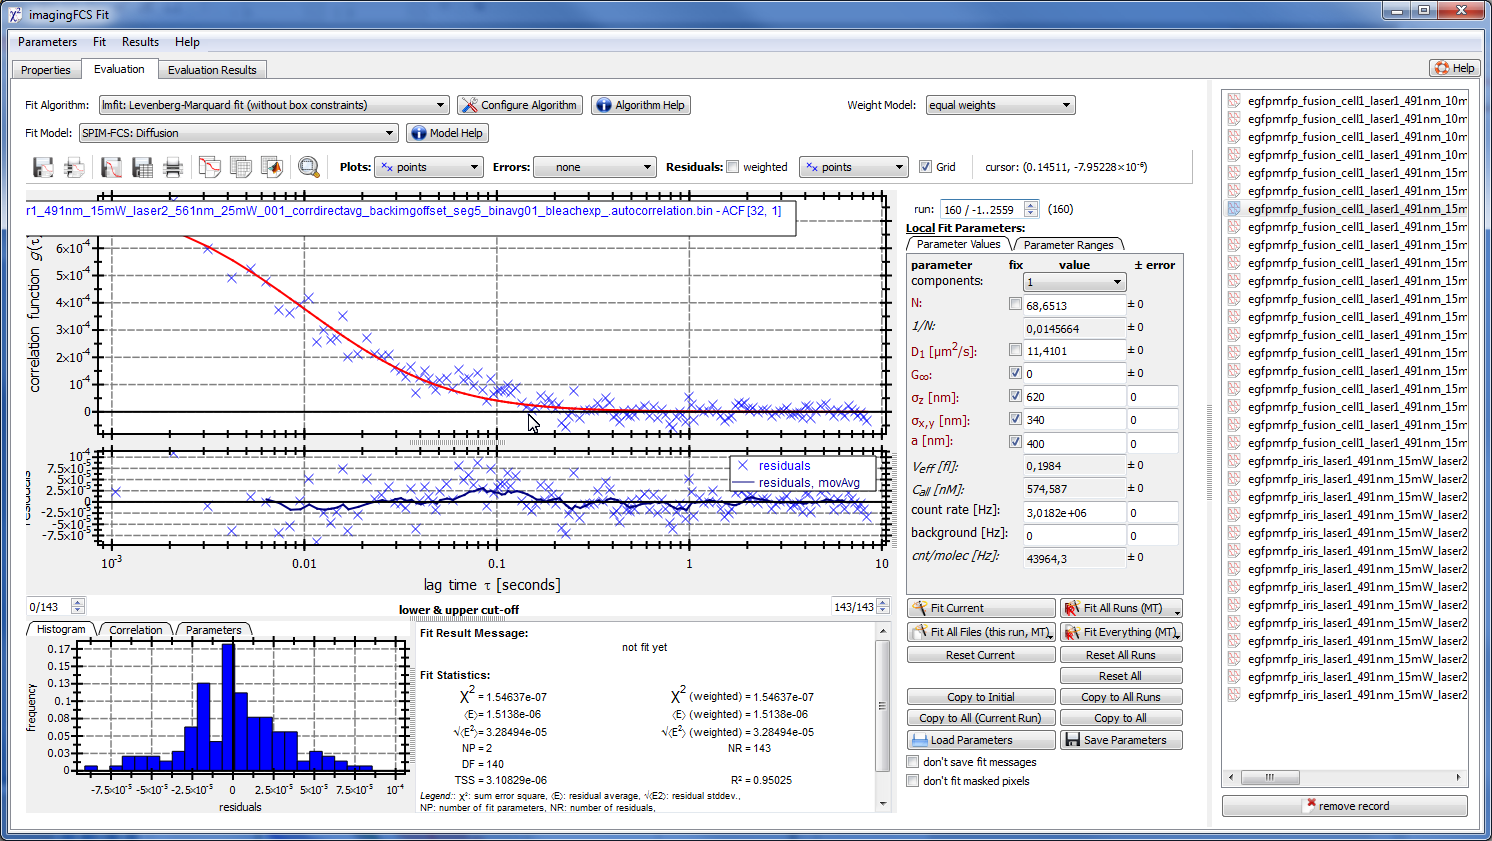
QF3_screen_imfcs.png
added QuickFit3 screenshots
2019-01-12 14:21:18 +01:00
QF3_screen_imfcsfit.png
added QuickFit3 screenshots
2019-01-12 14:21:18 +01:00
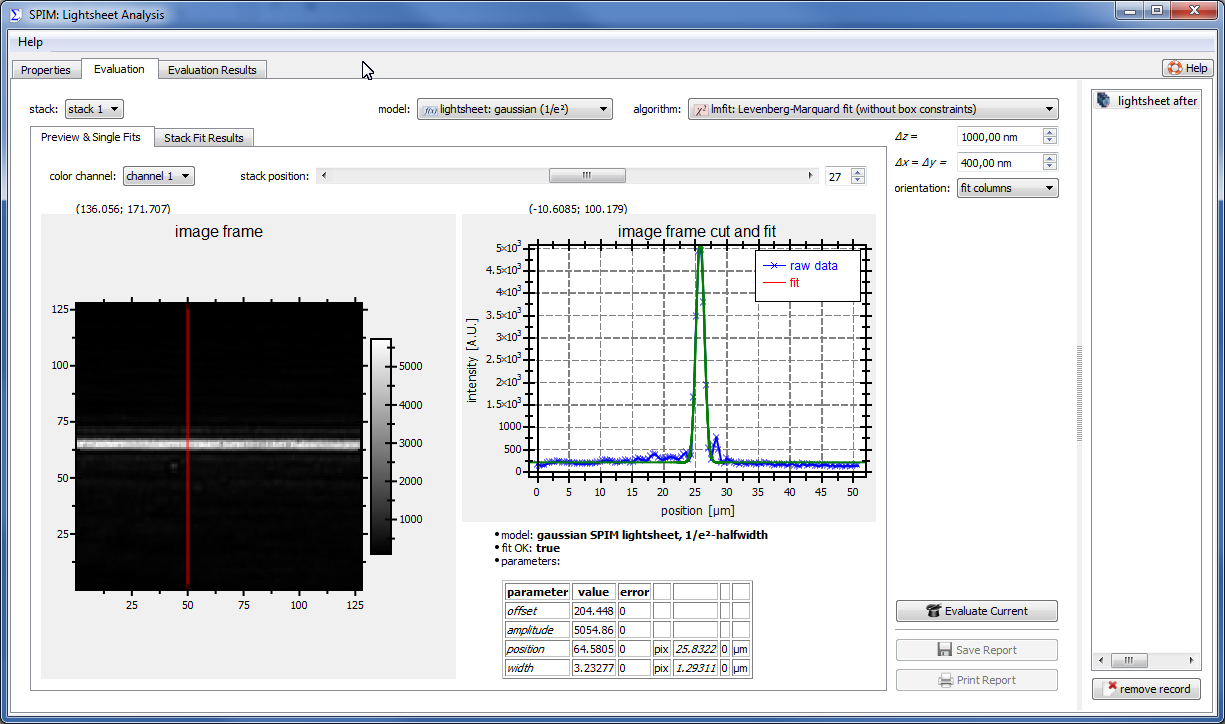
QF3_screen_lightsheet.png
added QuickFit3 screenshots
2019-01-12 14:21:18 +01:00
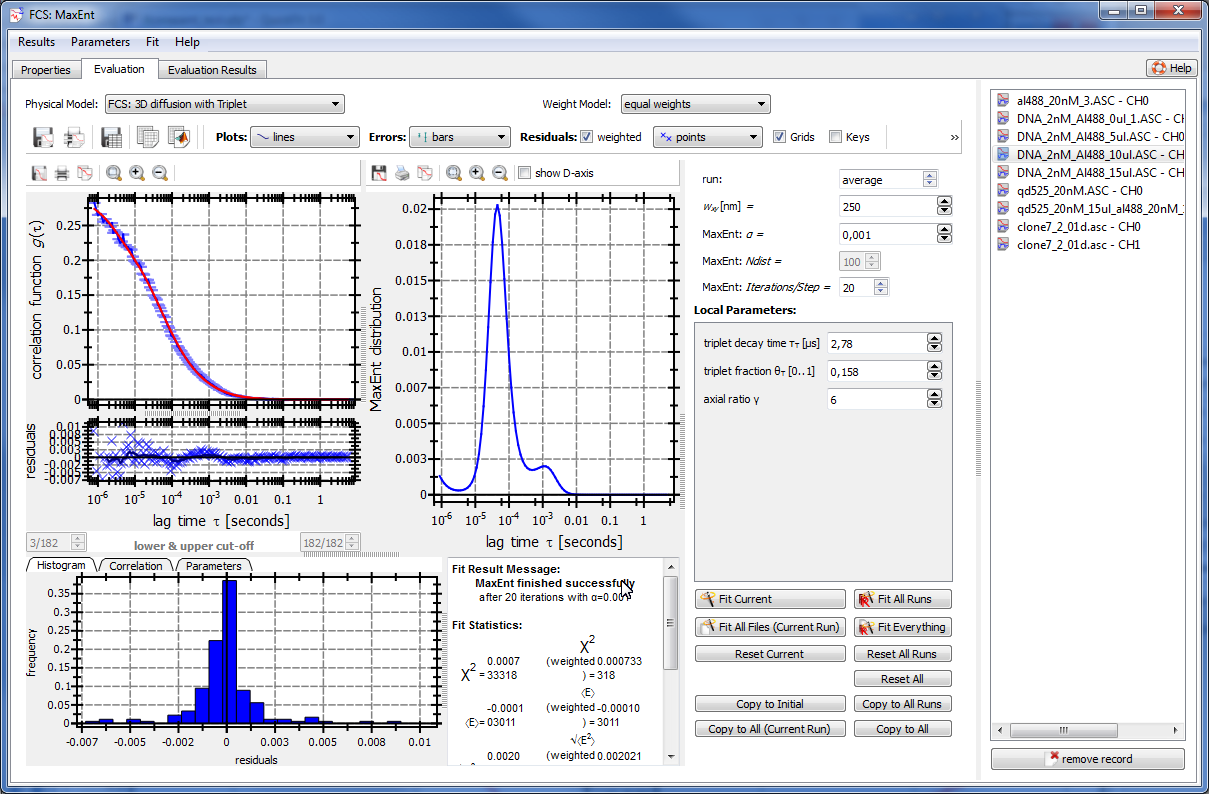
QF3_screen_maxent.png
added QuickFit3 screenshots
2019-01-12 14:21:18 +01:00
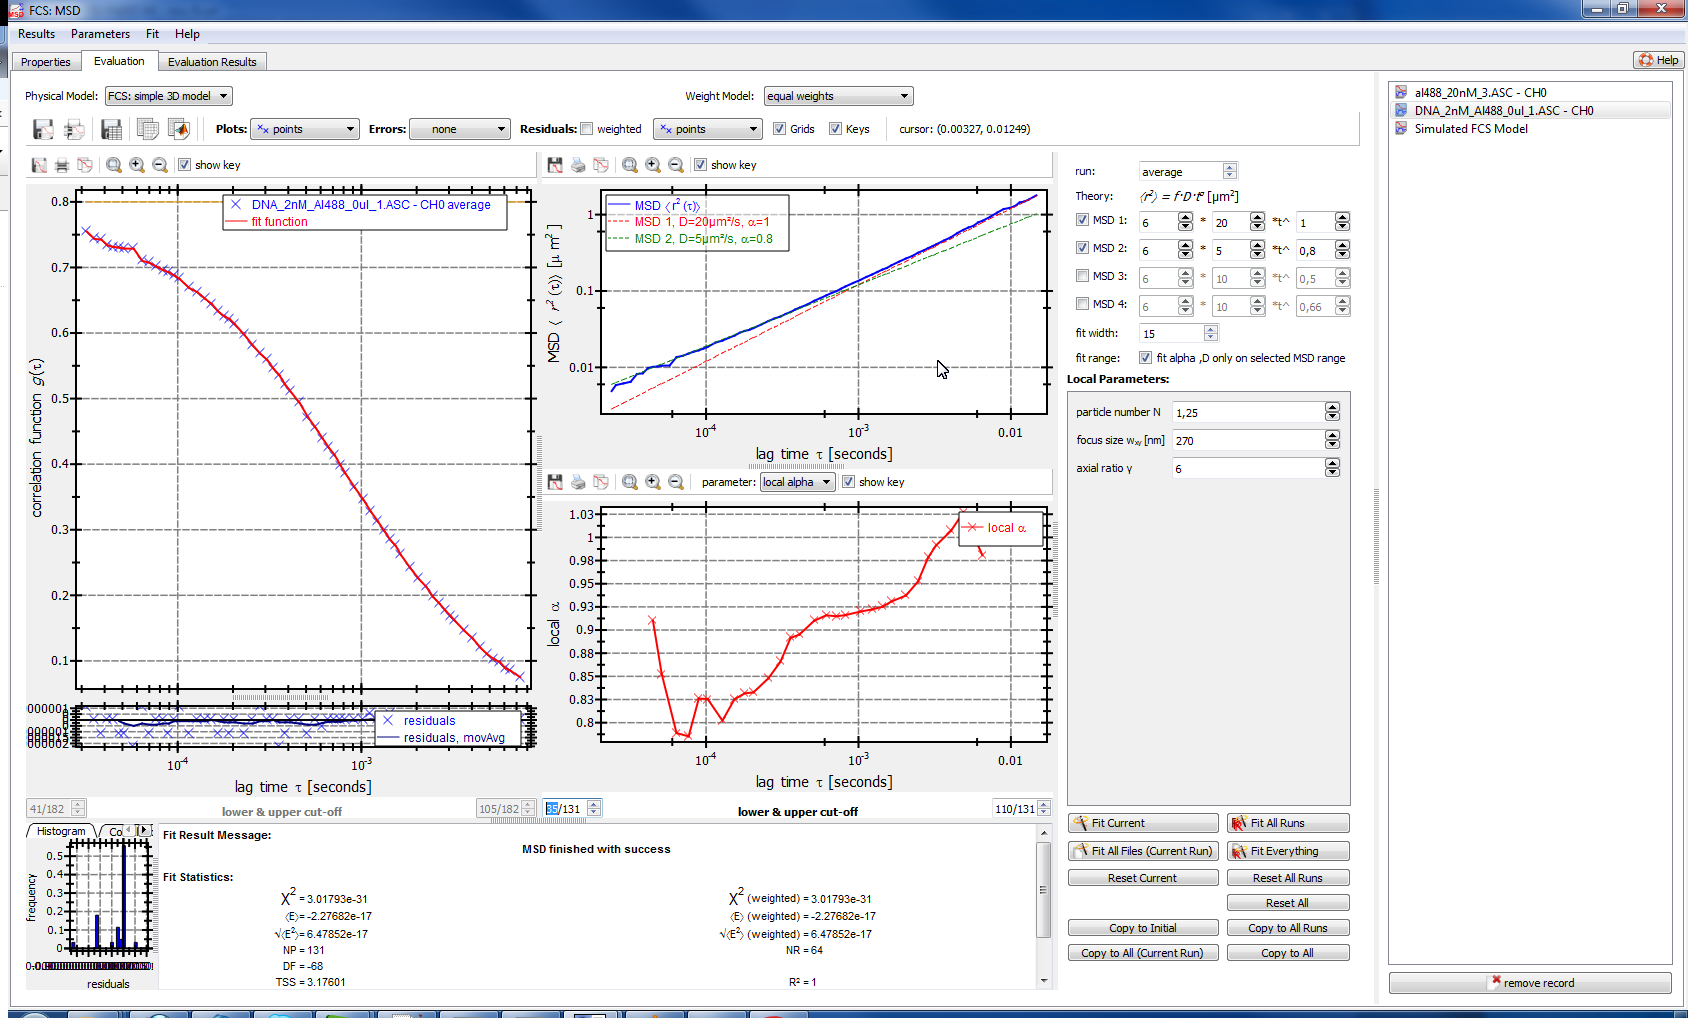
QF3_screen_msd.png
added QuickFit3 screenshots
2019-01-12 14:21:18 +01:00
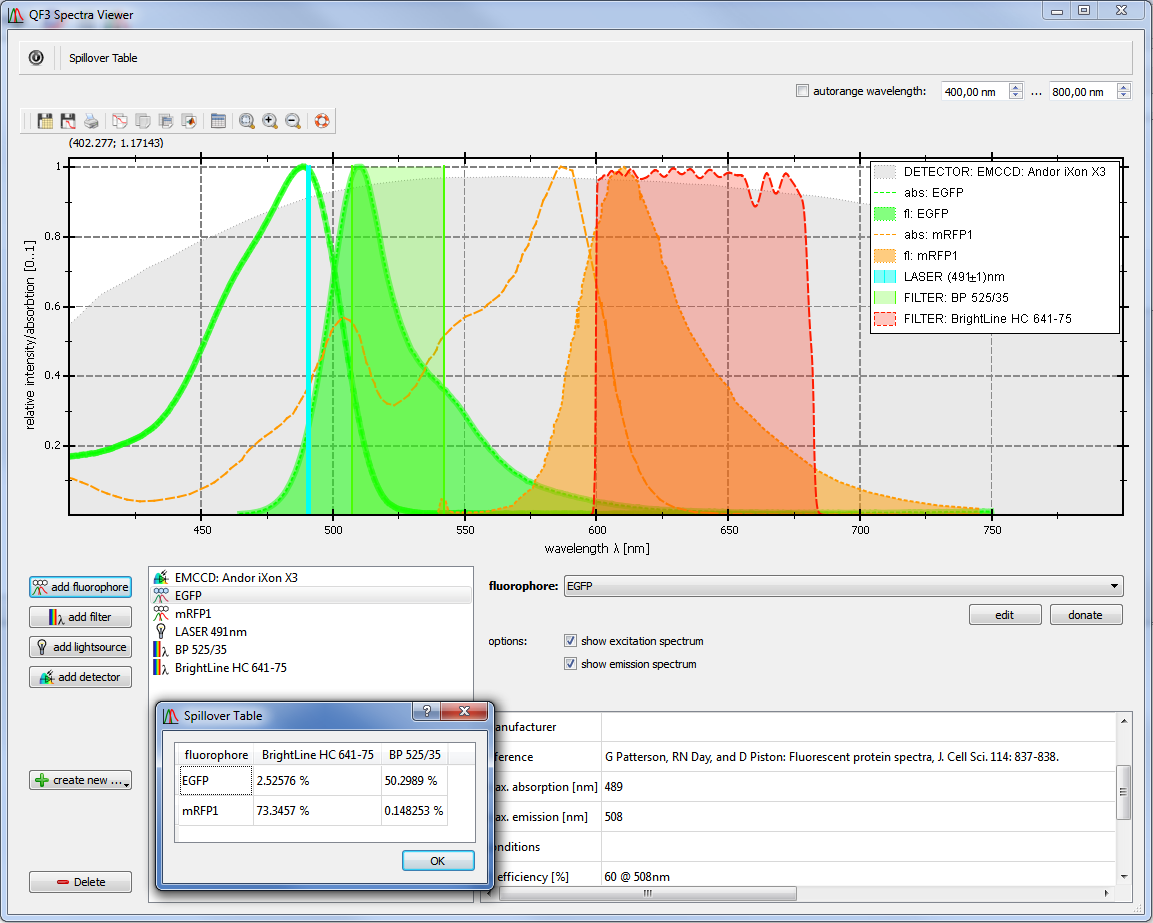
QF3_screen_spectra.png
added QuickFit3 screenshots
2019-01-12 14:21:18 +01:00
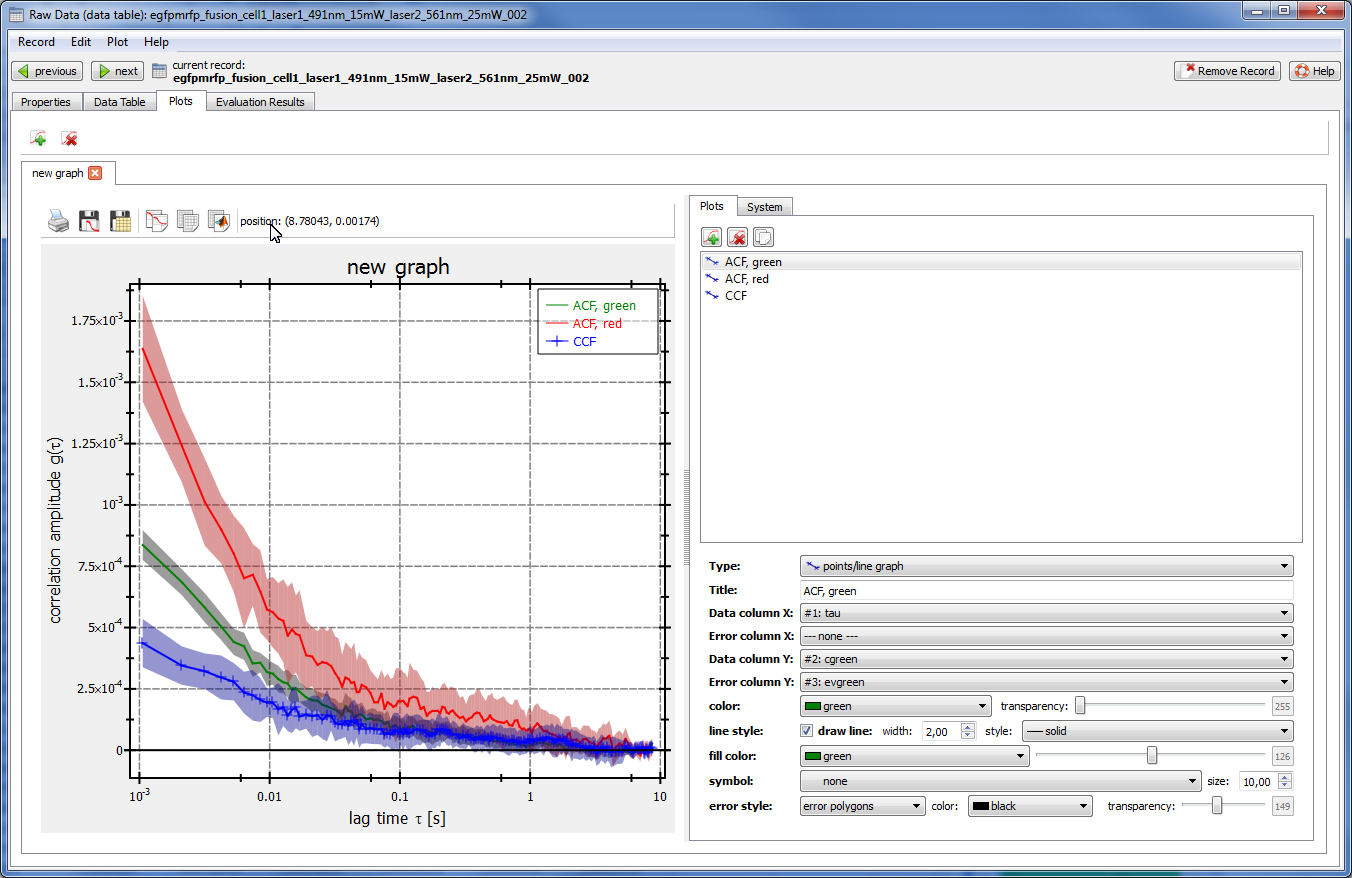
QF3_screen_tableplot.png
added QuickFit3 screenshots
2019-01-12 14:21:18 +01:00
README.md
- added new graph: JKQTPSingleColumnSymbolsGraph
2019-01-20 16:15:10 +01:00
screen_barcharts.png
w
2015-07-11 17:47:57 +02:00
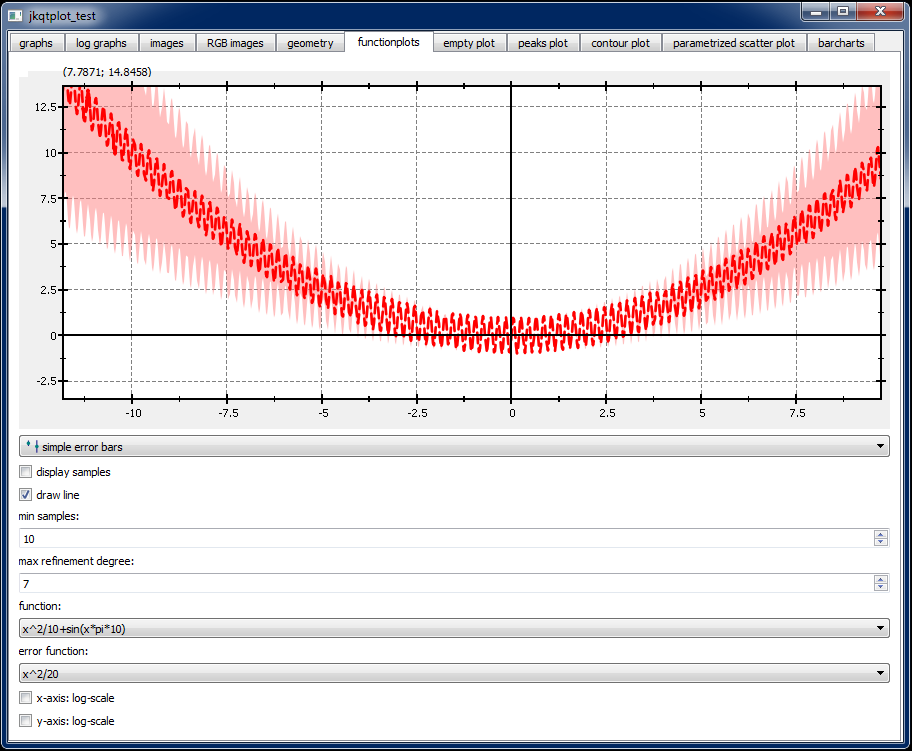
screen_functionplot.png
w
2015-07-11 17:47:57 +02:00
screen_images_latex.png
w
2015-07-11 18:06:49 +02:00
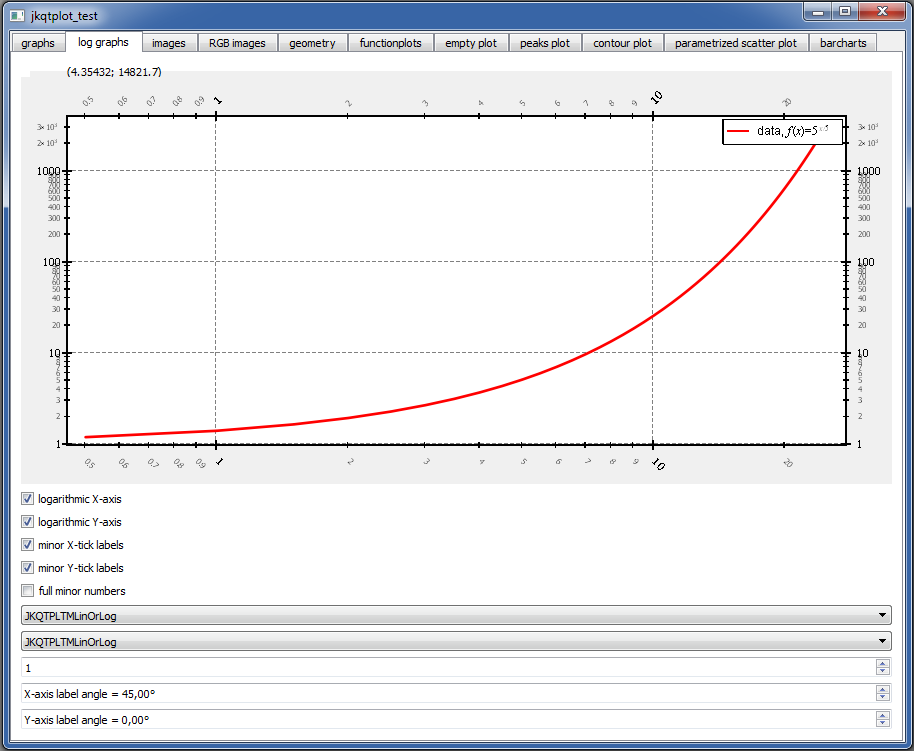
screen_loglog.png
w
2015-07-11 17:47:57 +02:00
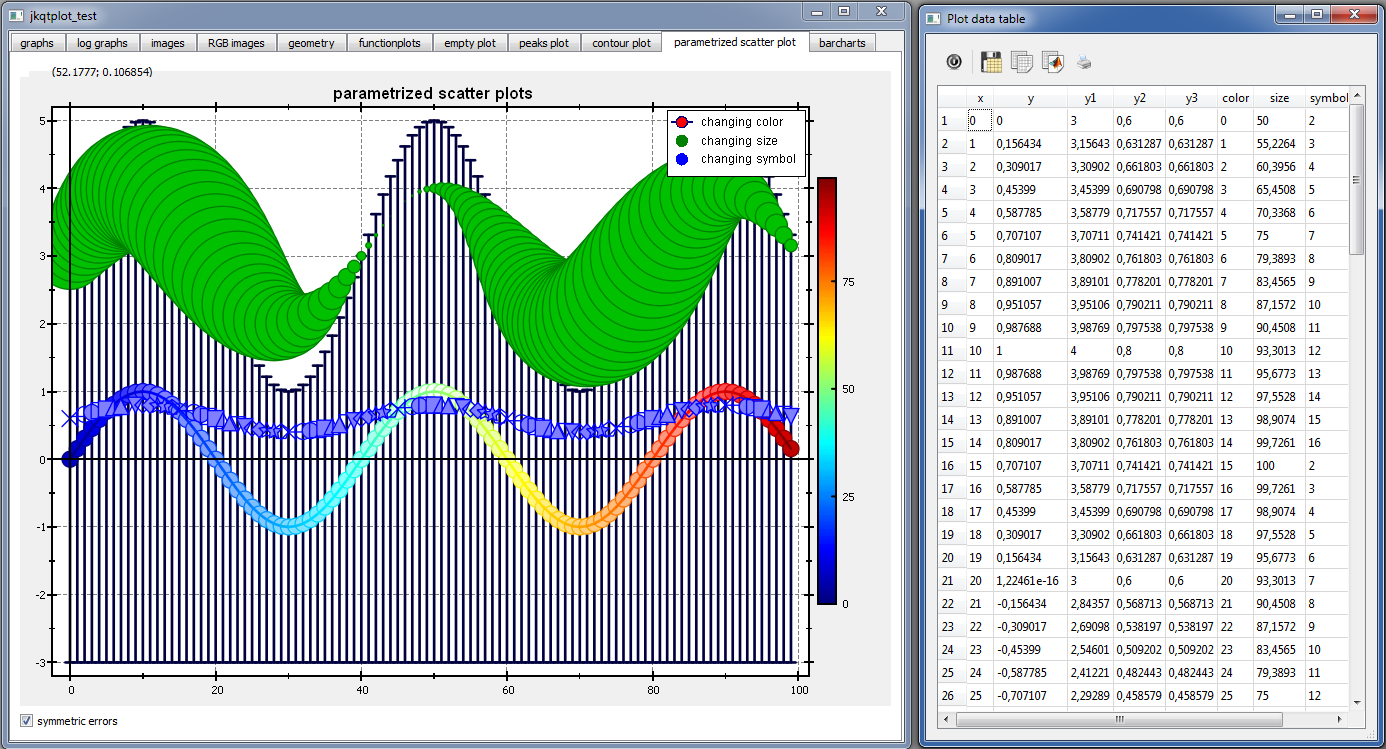
screen_parmetrizedplots_datatable.png
w
2015-07-11 17:47:57 +02:00
screen_scatter.png
w
2015-07-11 18:06:49 +02:00
screenshotsbanner.png
added missing documentation images
2019-01-12 14:08:32 +01:00
test_distributionplot_small.png
- added new graph: JKQTPSingleColumnSymbolsGraph
2019-01-20 16:15:10 +01:00
test_distributionplot.png
- added new graph: JKQTPSingleColumnSymbolsGraph
2019-01-20 16:15:10 +01:00
test_multiplot_controlwindow.png
- fixed zoomin/synchronized graphs, which was broken by former update to user-interaction
2019-02-03 14:08:16 +01:00
test_multiplot_printpreview.png
added example for arranging plots in a QGridLayout
2018-12-13 22:29:37 +01:00
test_multiplot_small.png
added example for arranging plots in a QGridLayout
2018-12-13 22:29:37 +01:00
test_multiplot.png
added example for arranging plots in a QGridLayout
2018-12-13 22:29:37 +01:00
