mirror of
https://github.com/jkriege2/JKQtPlotter.git
synced 2025-01-25 06:59:28 +08:00
70 lines
3.7 KiB
Markdown
70 lines
3.7 KiB
Markdown
# Example (JKQTPlotter): Parametrized Scatter-graph with custom symbols {#JKQTPlotterparamscatterCustomSymbol}
|
|
|
|
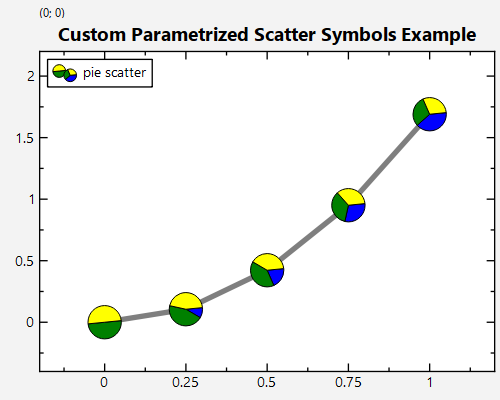
This project (see `./examples/paramscatterplot_customsymbol/`) demonstrates using JKQTPlotter to draw a parametrized scatter graph (JKQTPXYParametrizedScatterGraph) with custom symbols. To demonstrate this, we create a plot with several symbols, connected by a line, where each symbol shows a pie-chart with varying fractions.
|
|
|
|
The source code of the example can be found in [`paramscatterplot_customsymbol.cpp`](https://github.com/jkriege2/JKQtPlotter/tree/master/examples/paramscatterplot_customsymbol/paramscatterplot_customsymbol.cpp).
|
|
|
|
First we create a plotter window and get a pointer to the internal datastore (for convenience). Then we add three new datacolumns and obtain back inserters.
|
|
```.cpp
|
|
JKQTPlotter plot;
|
|
JKQTPDatastore* ds=plot.getDatastore();
|
|
|
|
size_t columnX=ds->addColumn("x");
|
|
auto colXInserter=ds->backInserter(columnX);
|
|
size_t columnY=ds->addColumn("y");
|
|
auto colYInserter=ds->backInserter(columnY);
|
|
size_t columnS=ds->addColumn("sym");
|
|
auto colSInserter=ds->backInserter(columnS);
|
|
```
|
|
Now we define a functor that draws a pie chart with three segments with fractions `f1` (blue), `f2` (green) and `1.0-f1-f2` (yellow):
|
|
```.cpp
|
|
auto pieFunc=[](QPainter& p, double f1, double f2) {
|
|
double f3=1.0-f1-f2;
|
|
QRectF rec(-0.5,-0.5,1,1);
|
|
p.setPen(QPen(QColor("black"), p.pen().width(), Qt::SolidLine));
|
|
p.setBrush(QBrush(QColor("blue")));
|
|
p.drawPie(rec, 90, -f1*360*16);
|
|
p.setBrush(QBrush(QColor("green")));
|
|
p.drawPie(rec, 90-f1*360*16, -f2*360*16);
|
|
p.setBrush(QBrush(QColor("yellow")));
|
|
p.drawPie(rec, 90-(f1+f2)*360*16, -f3*360*16);
|
|
};
|
|
```
|
|
Now we create data for the plot, x and y follow a simple function and the symbols are encoded in a separated column, where for each datapoint, we register a new symbol using JKQTPRegisterCustomGraphSymbol(), which is drawn by a differently parametrized (f1,f2) functor pieFunc.
|
|
```.cpp
|
|
const int Ndata=5;
|
|
for (int i=0; i<Ndata; i++) {
|
|
// put data
|
|
const double x=double(i)/double(Ndata-1);
|
|
*(colXInserter++)=x;
|
|
*(colYInserter++)=pow(x*1.3, 2.0);
|
|
*(colSInserter++)=JKQTPRegisterCustomGraphSymbol(std::bind(pieFunc, std::placeholders::_1, x*0.4, 0.5-x*0.2));
|
|
}
|
|
```
|
|
Finally we create a graph in the plot, which displays our datasets:
|
|
```.cpp
|
|
JKQTPXYParametrizedScatterGraph* graph1=new JKQTPXYParametrizedScatterGraph(&plot);
|
|
graph1->setXColumn(columnX);
|
|
graph1->setYColumn(columnY);
|
|
graph1->setSymbolSize(25);
|
|
graph1->setDrawLine(true);
|
|
graph1->setLineWidth(4);
|
|
graph1->setDrawLineInForeground(false);
|
|
graph1->setColor(QColor("black"));
|
|
graph1->setTitle(QObject::tr("pie scatter"));
|
|
```
|
|
The symbol type is stored in columnS, note however how we have to give a custom JKQTPXYParametrizedScatterGraph::symbolColumnFunctor, because the default one maps the values in the column to the range `[0...JKQTPMaxSymbolID]` in a cycling fashion (using a mod operation), but here we want to use the `stored ID directly.
|
|
```.cpp
|
|
graph1->setSymbolColumn(columnS);
|
|
graph1->setSymbolColumnFunctor(std::bind([](double /*x*/, double /*y*/, double symbolcolumn)->JKQTPGraphSymbols {
|
|
return static_cast<JKQTPGraphSymbols>(floor(symbolcolumn));
|
|
}, std::placeholders::_1, std::placeholders::_2, std::placeholders::_3));
|
|
plot.addGraph(graph1);
|
|
```
|
|
The result looks like this:
|
|
|
|

|
|
|
|
|
|
|