..
advancedlineandfillstyling_small.png
updated more example images
2022-08-26 22:41:10 +02:00
advancedlineandfillstyling.png
added more auto-generated screenshots
2022-08-26 22:32:48 +02:00
barchart_hor_small.png
JKQTMathText:
2022-09-01 14:36:34 +02:00
barchart_hor.png
JKQTMathText:
2022-09-01 14:36:34 +02:00
barchart_small.png
JKQTMathText:
2022-09-01 14:36:34 +02:00
barchart_twocolor_hor_small.png
JKQTPlotter: NEW: barcharts (derived from JKQTPBarGraphBase) can be configured to use different fill styles above and below the baseline
2022-09-10 14:35:16 +02:00
barchart_twocolor_hor.png
JKQTPlotter: NEW: barcharts (derived from JKQTPBarGraphBase) can be configured to use different fill styles above and below the baseline
2022-09-10 14:35:16 +02:00
barchart_twocolor_small.png
JKQTPlotter: NEW: barcharts (derived from JKQTPBarGraphBase) can be configured to use different fill styles above and below the baseline
2022-09-10 14:35:16 +02:00
barchart_twocolor.png
JKQTPlotter: NEW: barcharts (derived from JKQTPBarGraphBase) can be configured to use different fill styles above and below the baseline
2022-09-10 14:35:16 +02:00
barchart.png
JKQTMathText:
2022-09-01 14:36:34 +02:00
beeswarmplot_small.png
improved documentation
2019-02-03 20:25:25 +01:00
beeswarmplot.png
improved documentation
2019-02-03 20:25:25 +01:00
boxplot_small.png
JKQTPlotter: added examples for custom symbols
2022-09-07 21:38:29 +02:00
boxplot.png
JKQTPlotter: added examples for custom symbols
2022-09-07 21:38:29 +02:00
contextmenu_graph_visibility.png
added speed-test
2018-12-02 18:30:29 +01:00
contourplot_animated.gif
using CMake now to build examples
2019-06-20 22:24:47 +02:00
contourplot_ColorContoursFromPalette.png
using CMake now to build examples
2019-06-20 22:24:47 +02:00
contourplot_ColorContoursFromPaletteByValue.png
using CMake now to build examples
2019-06-20 22:24:47 +02:00
contourplot_overridecolors.png
using CMake now to build examples
2019-06-20 22:24:47 +02:00
contourplot_SingleColorContours.png
using CMake now to build examples
2019-06-20 22:24:47 +02:00
contourplot_small.png
updated many documentation images to auto-generated ones
2022-08-28 22:48:14 +02:00
contourplot.png
updated many documentation images to auto-generated ones
2022-08-28 22:48:14 +02:00
datastore_calccolumns.png
using CMake now to build examples
2019-06-20 22:24:47 +02:00
datastore_groupedstat_barchart.png
using CMake now to build examples
2019-06-20 22:24:47 +02:00
datastore_groupedstat_barchartrawdata.png
using CMake now to build examples
2019-06-20 22:24:47 +02:00
datastore_groupedstat_boxplot.png
using CMake now to build examples
2019-06-20 22:24:47 +02:00
datastore_groupedstat_scatter.png
using CMake now to build examples
2019-06-20 22:24:47 +02:00
datastore_groupedstat_scatterrawdata.png
using CMake now to build examples
2019-06-20 22:24:47 +02:00
datastore_groupedstat_small.png
using CMake now to build examples
2019-06-20 22:24:47 +02:00
datastore_groupedstat.png
using CMake now to build examples
2019-06-20 22:24:47 +02:00
datastore_image_sorted.png
using CMake now to build examples
2019-06-20 22:24:47 +02:00
datastore_image.png
using CMake now to build examples
2019-06-20 22:24:47 +02:00
datastore_iterators_cosine_yreplaced.png
using CMake now to build examples
2019-06-20 22:24:47 +02:00
datastore_iterators_cosine_ysorted.png
using CMake now to build examples
2019-06-20 22:24:47 +02:00
datastore_iterators_cosine.png
using CMake now to build examples
2019-06-20 22:24:47 +02:00
datastore_iterators_small.png
using CMake now to build examples
2019-06-20 22:24:47 +02:00
datastore_linkedcarray.png
using CMake now to build examples
2019-06-20 22:24:47 +02:00
datastore_map.png
using CMake now to build examples
2019-06-20 22:24:47 +02:00
datastore_regression_lin.png
using CMake now to build examples
2019-06-20 22:24:47 +02:00
datastore_regression_linrobust_p.png
using CMake now to build examples
2019-06-20 22:24:47 +02:00
datastore_regression_linrobust.png
using CMake now to build examples
2019-06-20 22:24:47 +02:00
datastore_regression_linweight.png
using CMake now to build examples
2019-06-20 22:24:47 +02:00
datastore_regression_nonlinreg.png
using CMake now to build examples
2019-06-20 22:24:47 +02:00
datastore_regression_polynom_errros.png
using CMake now to build examples
2019-06-20 22:24:47 +02:00
datastore_regression_polynom.png
using CMake now to build examples
2019-06-20 22:24:47 +02:00
datastore_regression_small.png
using CMake now to build examples
2019-06-20 22:24:47 +02:00
datastore_regression.png
using CMake now to build examples
2019-06-20 22:24:47 +02:00
datastore_sine.png
using CMake now to build examples
2019-06-20 22:24:47 +02:00
datastore_sineimg.png
using CMake now to build examples
2019-06-20 22:24:47 +02:00
datastore_small.png
using CMake now to build examples
2019-06-20 22:24:47 +02:00
datastore_statistics_2d_hist.png
using CMake now to build examples
2019-06-20 22:24:47 +02:00
datastore_statistics_2d_histcontour.png
using CMake now to build examples
2019-06-20 22:24:47 +02:00
datastore_statistics_2d_kde.png
using CMake now to build examples
2019-06-20 22:24:47 +02:00
datastore_statistics_2d_kdecontour.png
using CMake now to build examples
2019-06-20 22:24:47 +02:00
datastore_statistics_2d_marginhist.png
using CMake now to build examples
2019-06-20 22:24:47 +02:00
datastore_statistics_2d_marginkde.png
using CMake now to build examples
2019-06-20 22:24:47 +02:00
datastore_statistics_2d_scatteronly.png
using CMake now to build examples
2019-06-20 22:24:47 +02:00
datastore_statistics_2d_small.png
using CMake now to build examples
2019-06-20 22:24:47 +02:00
datastore_statistics_2d.png
using CMake now to build examples
2019-06-20 22:24:47 +02:00
datastore_statistics_boxplots_outliers.png
using CMake now to build examples
2019-06-20 22:24:47 +02:00
datastore_statistics_boxplots_simple.png
using CMake now to build examples
2019-06-20 22:24:47 +02:00
datastore_statistics_boxplots.png
using CMake now to build examples
2019-06-20 22:24:47 +02:00
datastore_statistics_cumhistkde.png
using CMake now to build examples
2019-06-20 22:24:47 +02:00
datastore_statistics_dataonly.png
using CMake now to build examples
2019-06-20 22:24:47 +02:00
datastore_statistics_hist.png
using CMake now to build examples
2019-06-20 22:24:47 +02:00
datastore_statistics_kde.png
using CMake now to build examples
2019-06-20 22:24:47 +02:00
datastore_statistics_small.png
using CMake now to build examples
2019-06-20 22:24:47 +02:00
datastore_statistics.png
using CMake now to build examples
2019-06-20 22:24:47 +02:00
dateaxes_dates_small.png
using CMake now to build examples
2019-06-20 22:24:47 +02:00
dateaxes_small.png
JKQTMathText:
2022-09-01 14:36:34 +02:00
dateaxes_timeaxis_small.png
JKQTPlotter: added examples for custom symbols
2022-09-07 21:38:29 +02:00
dateaxes_timeaxis.png
JKQTPlotter: added examples for custom symbols
2022-09-07 21:38:29 +02:00
dateaxes.png
JKQTMathText:
2022-09-01 14:36:34 +02:00
errorbarstyles_barcharts.png
using CMake now to build examples
2019-06-20 22:24:47 +02:00
errorbarstyles_filledcurves.png
using CMake now to build examples
2019-06-20 22:24:47 +02:00
errorbarstyles_impulses.png
using CMake now to build examples
2019-06-20 22:24:47 +02:00
errorbarstyles_small.png
JKQTPlotter: added examples for custom symbols
2022-09-07 21:38:29 +02:00
errorbarstyles.png
JKQTPlotter: added examples for custom symbols
2022-09-07 21:38:29 +02:00
evalcurve_small.png
JKQTMathText:
2022-09-01 14:36:34 +02:00
evalcurve.png
JKQTMathText:
2022-09-01 14:36:34 +02:00
examplesbanner.png
added missing documentation images
2019-01-12 14:08:32 +01:00
filledgraphs_small.png
JKQTMathText:
2022-09-01 14:36:34 +02:00
filledgraphs_y_small.png
JKQTMathText:
2022-09-01 14:36:34 +02:00
filledgraphs_y.png
JKQTMathText:
2022-09-01 14:36:34 +02:00
filledgraphs_yaxis.png
using CMake now to build examples
2019-06-20 22:24:47 +02:00
filledgraphs.png
JKQTMathText:
2022-09-01 14:36:34 +02:00
functionplot_fy_small.png
JKQTMathText:
2022-09-01 14:36:34 +02:00
functionplot_fy.png
JKQTMathText:
2022-09-01 14:36:34 +02:00
functionplot_small.png
JKQTMathText:
2022-09-01 14:36:34 +02:00
functionplot.png
JKQTMathText:
2022-09-01 14:36:34 +02:00
geo_arrows_small.png
improved arrows in geometric elements:
2020-08-23 13:13:53 +02:00
geo_arrows.png
improved arrows in geometric elements:
2020-08-23 13:13:53 +02:00
geo_simple_small.png
added simple geometric example, which produces the images fro teh documentation
2020-09-03 23:09:15 +02:00
geo_simple.png
added simple geometric example, which produces the images fro teh documentation
2020-09-03 23:09:15 +02:00
geometric_loglog_DrawAsGraphicElement.png
- improved: geometric objects now use an adaptive drawing algorithm to represent curves (before e.g. ellipses were always separated into a fixed number of line-segments)
2020-09-03 23:08:52 +02:00
geometric_loglog_DrawAsMathematicalCurve.png
- improved: geometric objects now use an adaptive drawing algorithm to represent curves (before e.g. ellipses were always separated into a fixed number of line-segments)
2020-09-03 23:08:52 +02:00
geometric_small.png
JKQTPlotter: added examples for custom symbols
2022-09-07 21:38:29 +02:00
geometric.png
JKQTPlotter: added examples for custom symbols
2022-09-07 21:38:29 +02:00
imageplot__scale02.png
using CMake now to build examples
2019-06-20 22:24:47 +02:00
imageplot__smallscalecolor.png
using CMake now to build examples
2019-06-20 22:24:47 +02:00
imageplot__smallscalelimitcolor.png
using CMake now to build examples
2019-06-20 22:24:47 +02:00
imageplot__smallscaletransparent.png
using CMake now to build examples
2019-06-20 22:24:47 +02:00
imageplot_cimg_small.png
added CImg interface (header-only) + examples
2019-11-16 13:50:43 +01:00
imageplot_cimg.png
added CImg interface (header-only) + examples
2019-11-16 13:50:43 +01:00
imageplot_modifier_imageonly.png
using CMake now to build examples
2019-06-20 22:24:47 +02:00
imageplot_modifier_modifieronly.png
using CMake now to build examples
2019-06-20 22:24:47 +02:00
imageplot_modifier_small.png
JKQTMathText:
2022-09-01 14:36:34 +02:00
imageplot_modifier.png
JKQTMathText:
2022-09-01 14:36:34 +02:00
imageplot_nodatastore_small.png
JKQTMathText:
2022-09-01 14:36:34 +02:00
imageplot_nodatastore.png
JKQTMathText:
2022-09-01 14:36:34 +02:00
imageplot_opencv_small.png
using CMake now to build examples
2019-06-20 22:24:47 +02:00
imageplot_opencv.png
using CMake now to build examples
2019-06-20 22:24:47 +02:00
imageplot_small.png
JKQTMathText:
2022-09-01 14:36:34 +02:00
imageplot_userpal_1_linear.png
* reworked color-palette-system:
2019-07-28 16:30:50 +02:00
imageplot_userpal_2_linear.png
* reworked color-palette-system:
2019-07-28 16:30:50 +02:00
imageplot_userpal_palsimple.png
* reworked color-palette-system:
2019-07-28 16:30:50 +02:00
imageplot_userpal_palsteps2.png
* reworked color-palette-system:
2019-07-28 16:30:50 +02:00
imageplot_userpal_program_small.png
JKQTPlotter: added examples for custom symbols
2022-09-07 21:38:29 +02:00
imageplot_userpal_program.png
JKQTPlotter: added examples for custom symbols
2022-09-07 21:38:29 +02:00
imageplot_userpal.png
* reworked color-palette-system:
2019-07-28 16:30:50 +02:00
imageplot.png
JKQTMathText:
2022-09-01 14:36:34 +02:00
impulsesplot_baseline.png
using CMake now to build examples
2019-06-20 22:24:47 +02:00
impulsesplot_horizontal.png
using CMake now to build examples
2019-06-20 22:24:47 +02:00
impulsesplot_small.png
JKQTMathText:
2022-09-01 14:36:34 +02:00
impulsesplot_symbols.png
using CMake now to build examples
2019-06-20 22:24:47 +02:00
impulsesplot.png
JKQTMathText:
2022-09-01 14:36:34 +02:00
jkqtfastplotter_test_small.png
moved build-projects for libs into their own subdirectories (works better with QMake, when building different libs) + necessary docu updates
2019-02-09 15:25:16 +01:00
jkqtfastplotter_test.png
moved build-projects for libs into their own subdirectories (works better with QMake, when building different libs) + necessary docu updates
2019-02-09 15:25:16 +01:00
jkqtmathtext_render_output.png
NEW: added command line tool jkatmathtext_render that renders LaTeX into images, using it to generate the documentation images for JKQTMathText
2022-08-07 18:02:21 +02:00
jkqtmathtext_render_small.png
NEW: added command line tool jkatmathtext_render that renders LaTeX into images, using it to generate the documentation images for JKQTMathText
2022-08-07 18:02:21 +02:00
jkqtmathtext_simpletest_small.png
reformated examples markdown-pages
2018-11-26 22:35:21 +01:00
jkqtmathtext_simpletest.png
added simple JKQTmathText example
2015-08-02 15:42:09 +02:00
jkqtmathtext_testapp_small.png
- added new graph: JKQTPSingleColumnSymbolsGraph
2019-01-20 16:15:10 +01:00
jkqtmathtext_testapp.png
- added new graph: JKQTPSingleColumnSymbolsGraph
2019-01-20 16:15:10 +01:00
JKQTPfilledVerticalRangeGraph_WithLines_small.png
improved documentation
2019-02-03 20:25:25 +01:00
jkqtplotter_cmakelink_small.png
fixed several doxygen errors
2022-07-24 14:50:28 +02:00
jkqtplotter_doc_imagegenerator_small.png
added command-line tool that auto-generates images for the JKQTPLotter documentation, implemented auto-generated plot-symbols
2022-09-02 22:59:41 +02:00
jkqtplotter_fastresizing.gif
- added styling system for JKQTPlotter (+example app)
2019-02-09 12:43:12 +01:00
jkqtplotter_test_user_interaction_small.gif
finished mouse interaction example + improved documentation
2019-02-04 13:15:56 +01:00
logaxes_highqmathrendering.png
using CMake now to build examples
2019-06-20 22:24:47 +02:00
logaxes_lowqmathrendering.png
using CMake now to build examples
2019-06-20 22:24:47 +02:00
logaxes_nolog.png
using CMake now to build examples
2019-06-20 22:24:47 +02:00
logaxes_nominorgrid.png
using CMake now to build examples
2019-06-20 22:24:47 +02:00
logaxes_small.png
using CMake now to build examples
2019-06-20 22:24:47 +02:00
logaxes.png
using CMake now to build examples
2019-06-20 22:24:47 +02:00
logaxis_set_labelType.png
improved log-axis-example
2018-12-03 23:09:12 +01:00
logaxis_set_minorticks.png
improved log-axis-example
2018-12-03 23:09:12 +01:00
mandelbrot_small.png
updated many documentation images to auto-generated ones
2022-08-28 22:48:14 +02:00
mandelbrot_zoom_pre.png
added Mandelbrot Set Explorer and an Example
2020-09-11 23:22:04 +02:00
mandelbrot_zoom.png
added Mandelbrot Set Explorer and an Example
2020-09-11 23:22:04 +02:00
mandelbrot.png
updated many documentation images to auto-generated ones
2022-08-28 22:48:14 +02:00
mscreen_cauchy.png
w
2015-07-11 18:06:49 +02:00
mscreen_maxwell.png
w
2015-07-11 18:06:49 +02:00
mscreen_rottaion.png
w
2015-07-11 18:06:49 +02:00
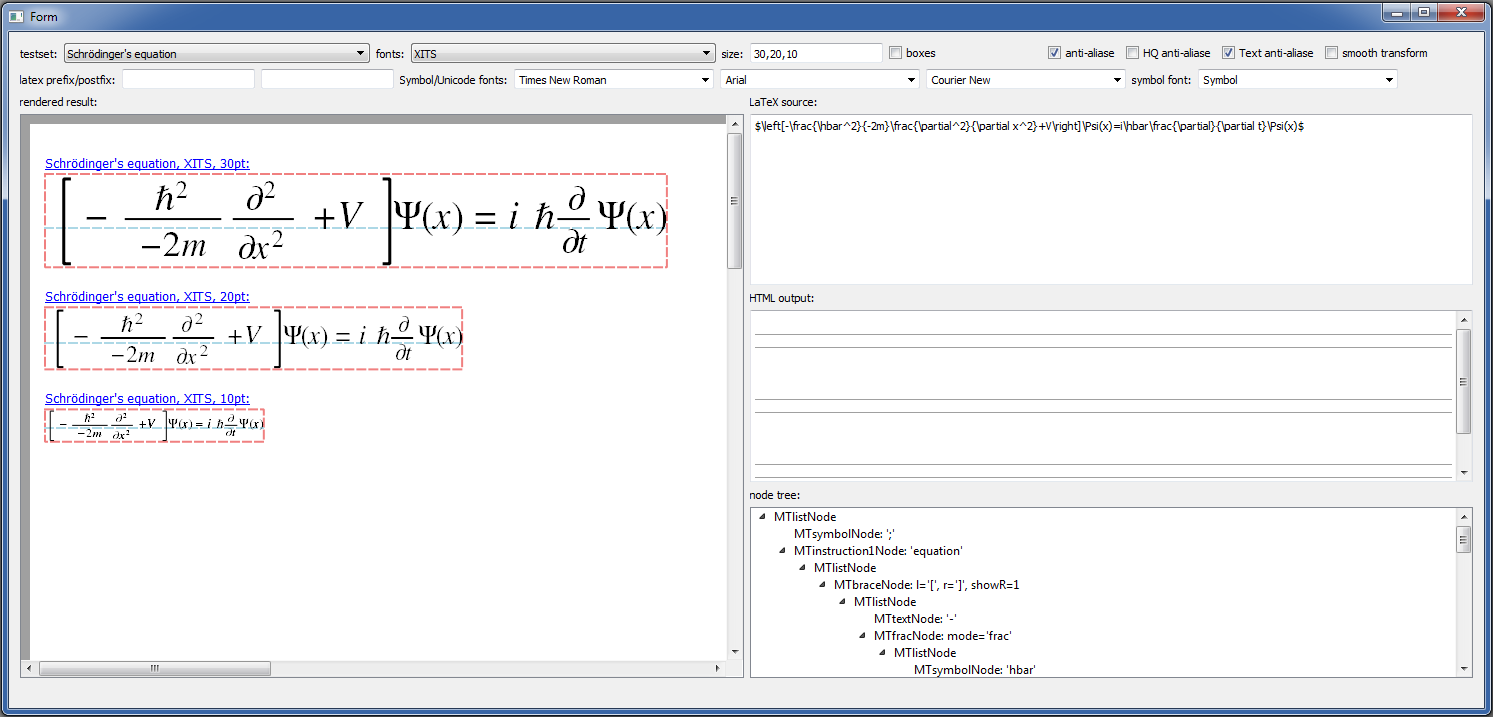
mscreen_schroedinger.png
w
2015-07-11 18:06:49 +02:00
mscreen_sd.png
w
2015-07-11 18:06:49 +02:00
multiplot_controlwindow_small.png
JKQTPlotter: added examples for custom symbols
2022-09-07 21:38:29 +02:00
multiplot_controlwindow.png
JKQTPlotter: added examples for custom symbols
2022-09-07 21:38:29 +02:00
multiplot_printpreview.png
updated many documentation images to auto-generated ones
2022-08-28 22:48:14 +02:00
multiplot_small.png
JKQTMathText:
2022-09-01 14:36:34 +02:00
multiplot.png
JKQTPlotter: added examples for custom symbols
2022-09-07 21:38:29 +02:00
parametriccurve1_small.png
JKQTMathText:
2022-09-01 14:36:34 +02:00
parametriccurve1.png
JKQTMathText:
2022-09-01 14:36:34 +02:00
parametriccurve2_small.png
JKQTMathText:
2022-09-01 14:36:34 +02:00
parametriccurve2.png
JKQTMathText:
2022-09-01 14:36:34 +02:00
parametriccurve_small.png
using CMake now to build examples
2019-06-20 22:24:47 +02:00
paramscatterplot_customsymbol_small.png
JKQTPlotter: added examples for custom symbols
2022-09-07 21:38:29 +02:00
paramscatterplot_customsymbol.png
JKQTPlotter: added examples for custom symbols
2022-09-07 21:38:29 +02:00
paramscatterplot_datatable.png
using CMake now to build examples
2019-06-20 22:24:47 +02:00
paramscatterplot_image_palette_triangle.png
using CMake now to build examples
2019-06-20 22:24:47 +02:00
paramscatterplot_image_palette.png
using CMake now to build examples
2019-06-20 22:24:47 +02:00
paramscatterplot_image_small.png
using CMake now to build examples
2019-06-20 22:24:47 +02:00
paramscatterplot_image_star.png
using CMake now to build examples
2019-06-20 22:24:47 +02:00
paramscatterplot_image_varsymbol.png
using CMake now to build examples
2019-06-20 22:24:47 +02:00
paramscatterplot_image.png
using CMake now to build examples
2019-06-20 22:24:47 +02:00
paramscatterplot_small.png
JKQTPlotter: added examples for custom symbols
2022-09-07 21:38:29 +02:00
paramscatterplot.png
JKQTPlotter: added examples for custom symbols
2022-09-07 21:38:29 +02:00
parsedfunctionplot_2overx_samplepoints.png
using CMake now to build examples
2019-06-20 22:24:47 +02:00
parsedfunctionplot_2overx.png
using CMake now to build examples
2019-06-20 22:24:47 +02:00
parsedfunctionplot_fy.png
using CMake now to build examples
2019-06-20 22:24:47 +02:00
parsedfunctionplot_small.png
JKQTMathText:
2022-09-01 14:36:34 +02:00
parsedfunctionplot.png
JKQTMathText:
2022-09-01 14:36:34 +02:00
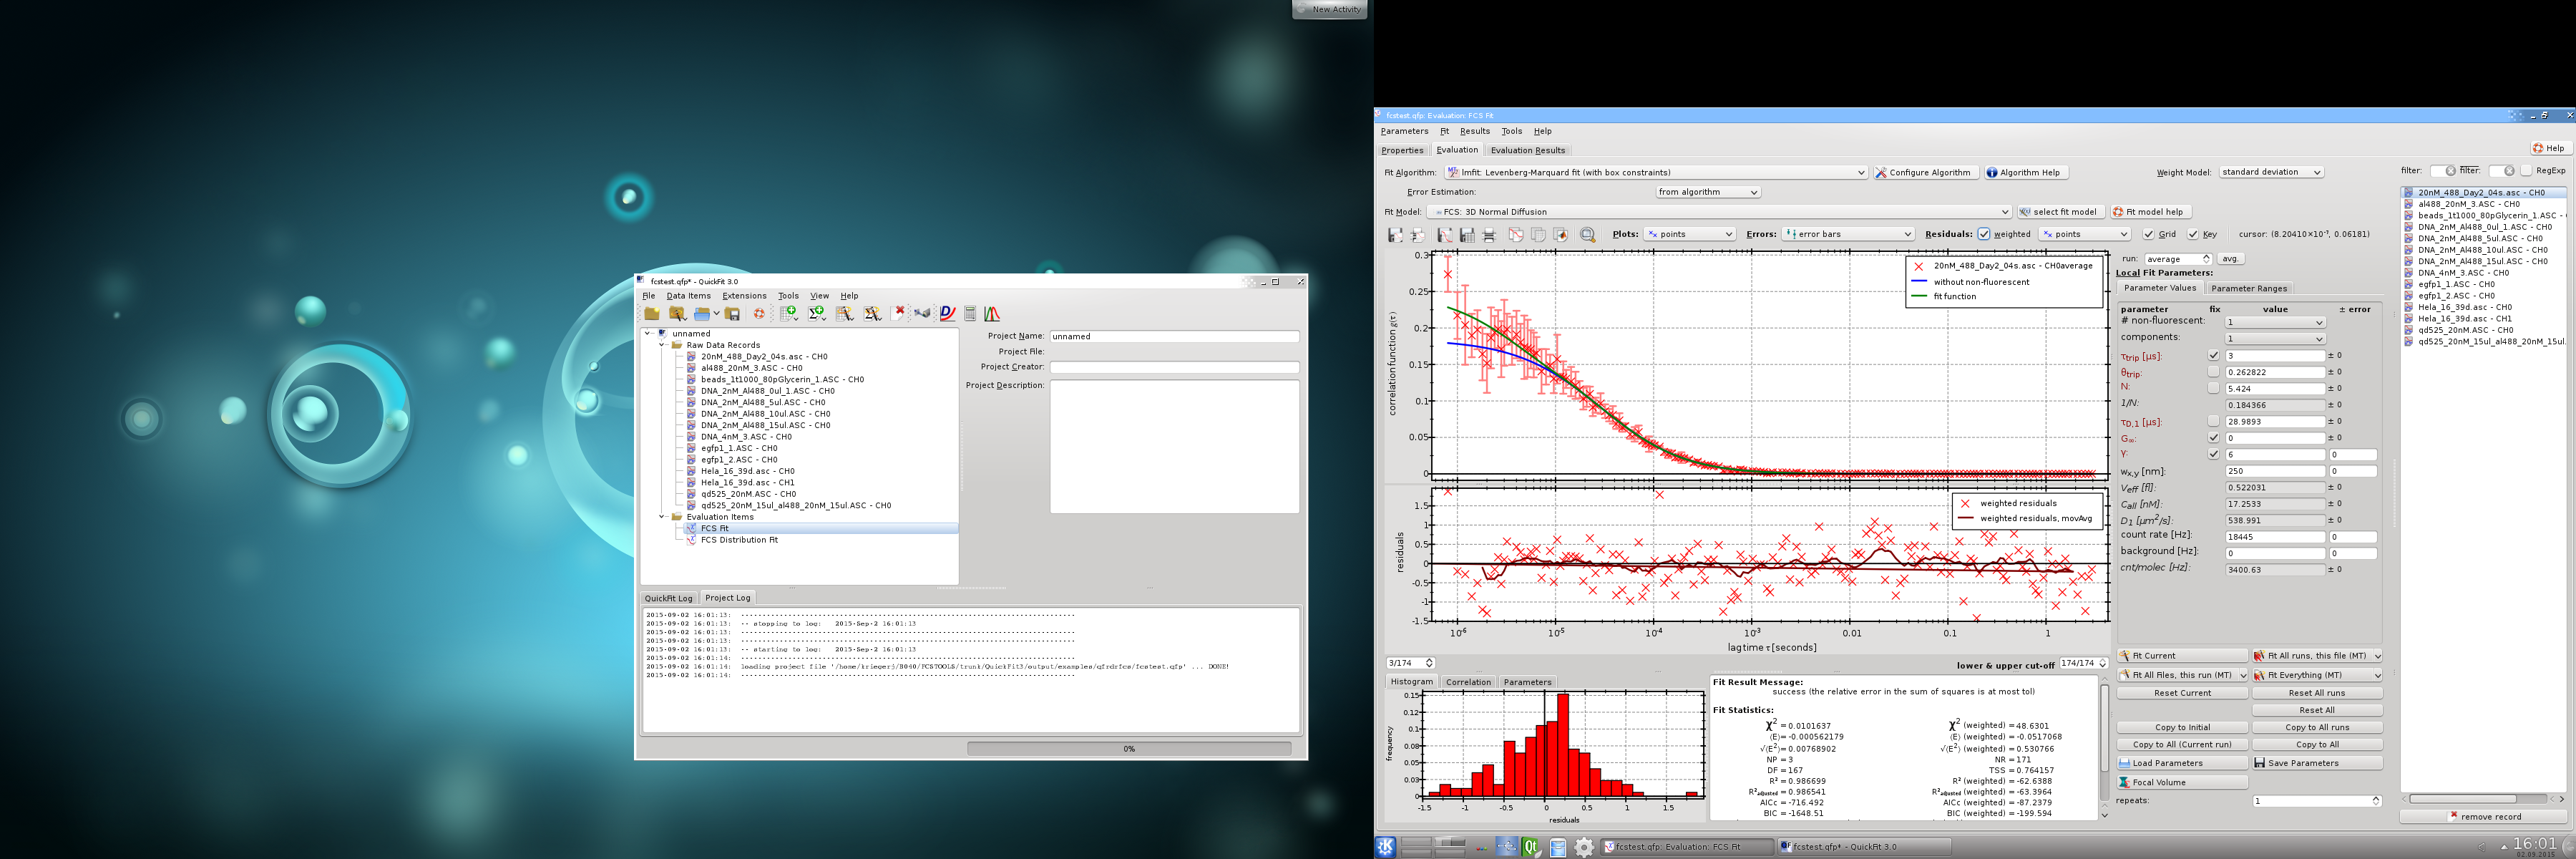
QF3_linux_screen_fcsfit.png
added QuickFit3 screenshots
2019-01-12 14:21:18 +01:00
QF3_screen_dcalc.png
added QuickFit3 screenshots
2019-01-12 14:21:18 +01:00
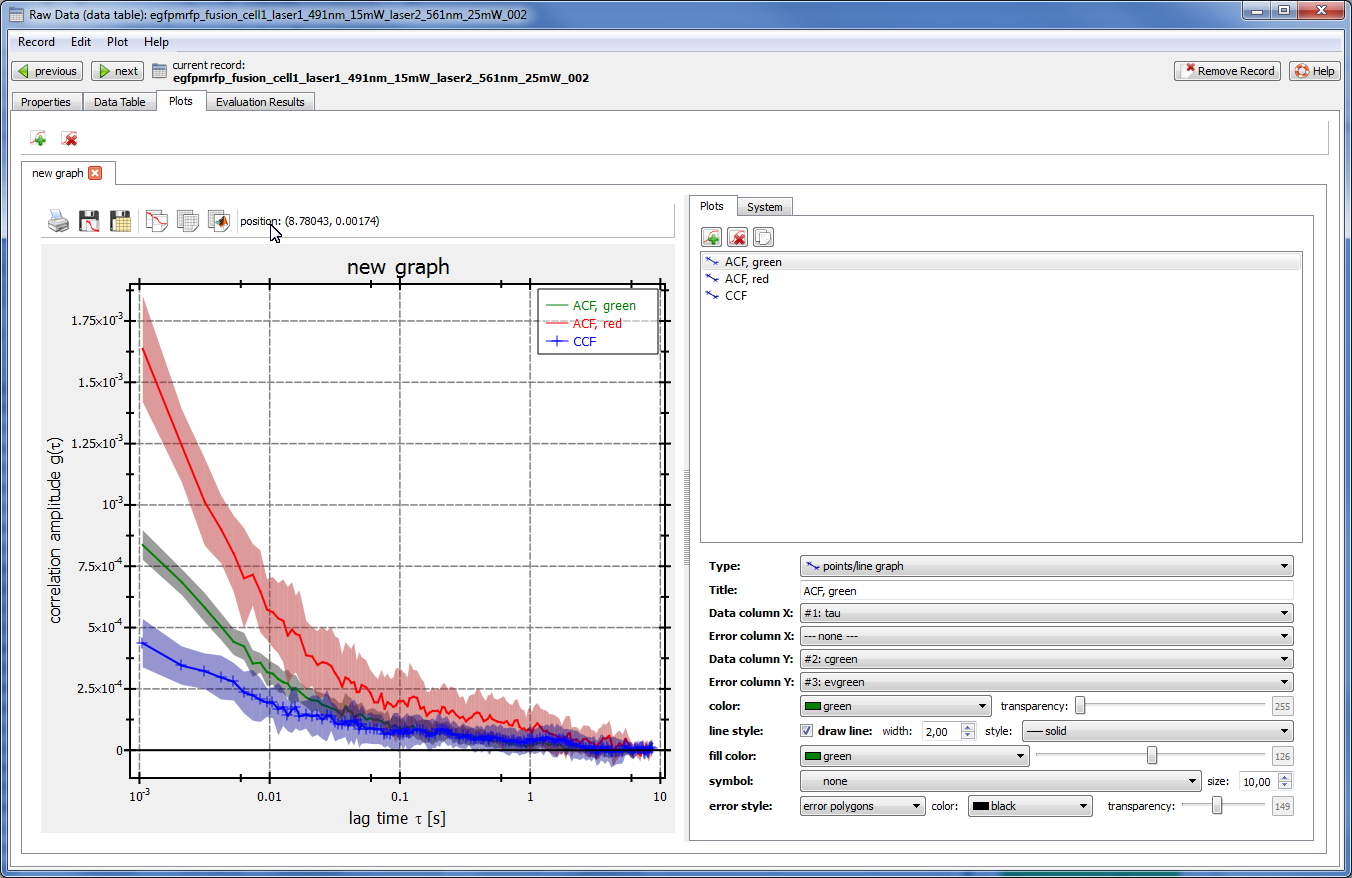
QF3_screen_fccsfit.png
added QuickFit3 screenshots
2019-01-12 14:21:18 +01:00
QF3_screen_fcsfit.png
added QuickFit3 screenshots
2019-01-12 14:21:18 +01:00
QF3_screen_imfccsfit.png
added QuickFit3 screenshots
2019-01-12 14:21:18 +01:00
QF3_screen_imfcs_paramcorrelation.png
added QuickFit3 screenshots
2019-01-12 14:21:18 +01:00
QF3_screen_imfcs.png
added QuickFit3 screenshots
2019-01-12 14:21:18 +01:00
QF3_screen_imfcsfit.png
added QuickFit3 screenshots
2019-01-12 14:21:18 +01:00
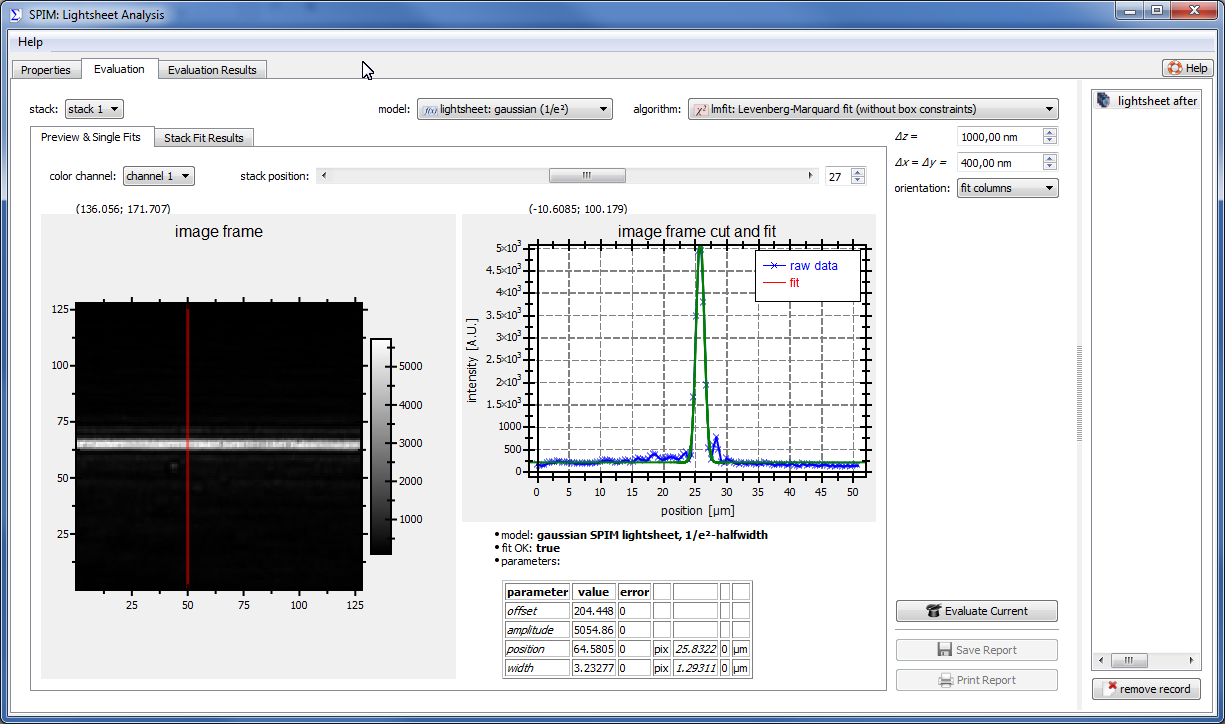
QF3_screen_lightsheet.png
added QuickFit3 screenshots
2019-01-12 14:21:18 +01:00
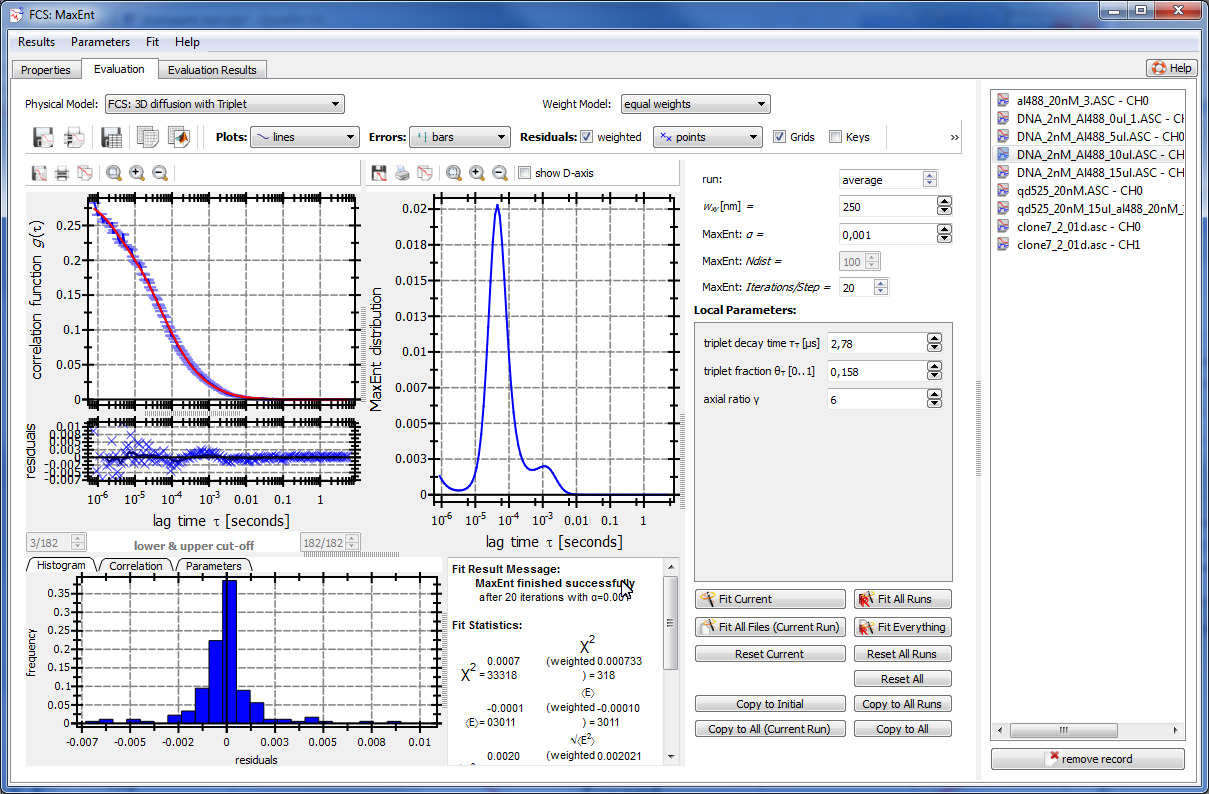
QF3_screen_maxent.png
added QuickFit3 screenshots
2019-01-12 14:21:18 +01:00
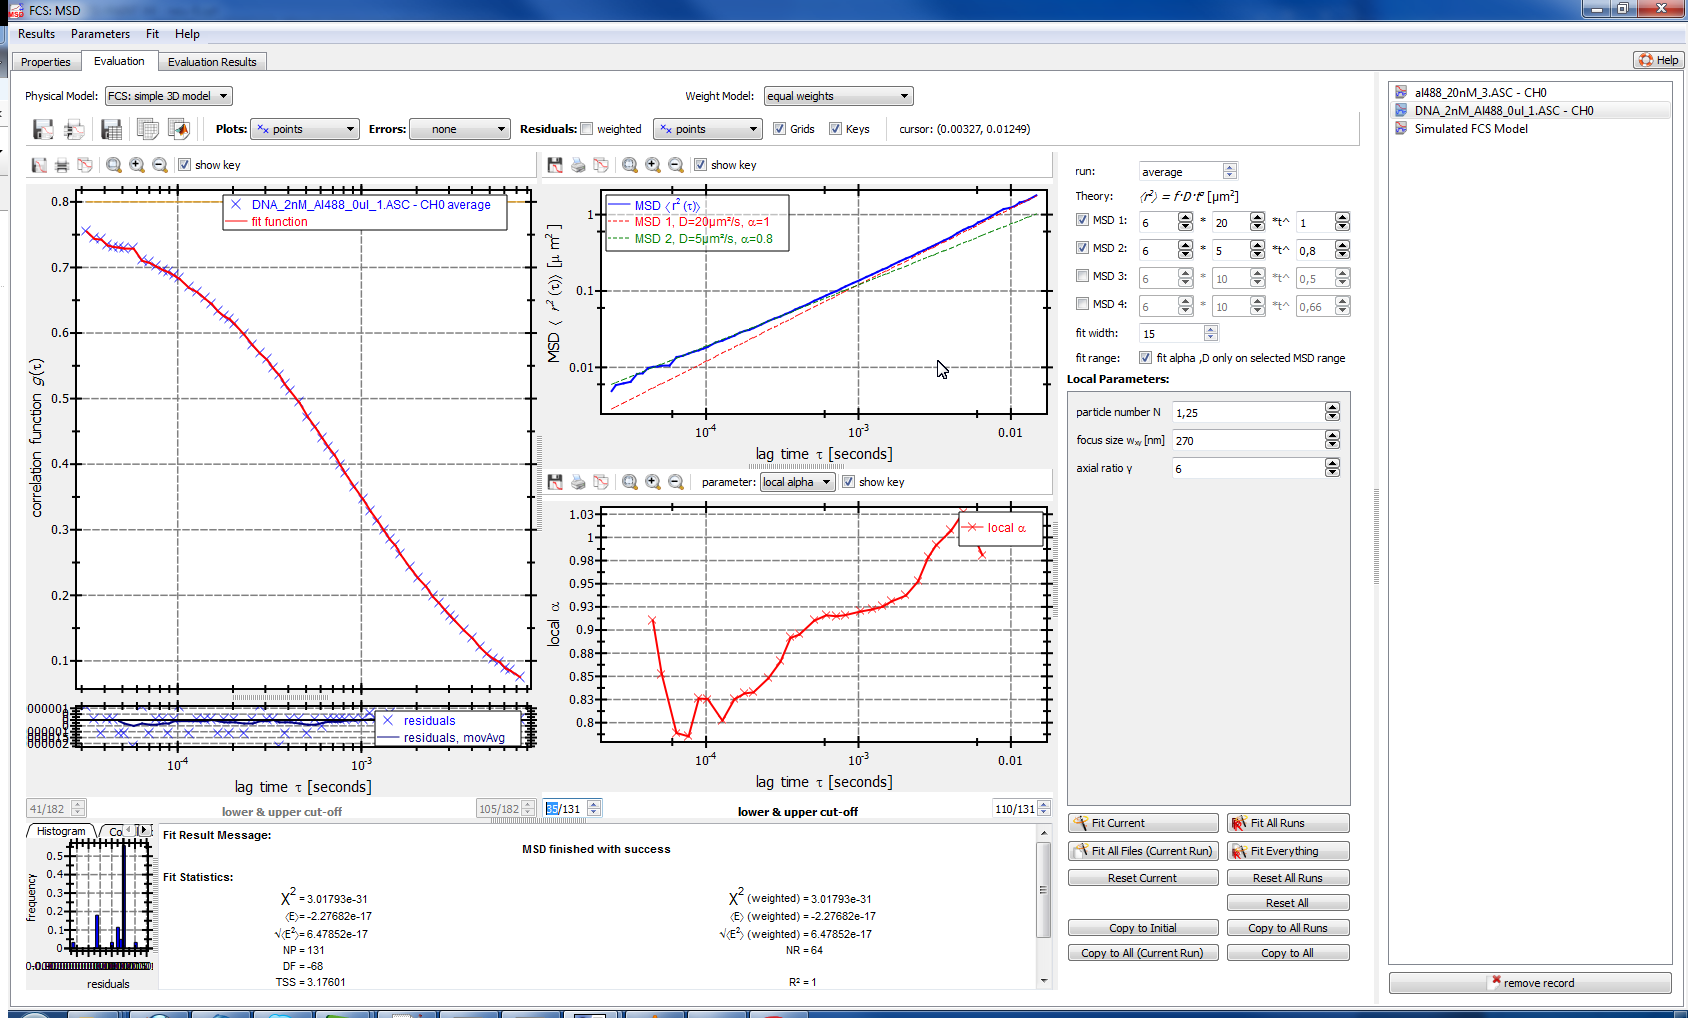
QF3_screen_msd.png
added QuickFit3 screenshots
2019-01-12 14:21:18 +01:00
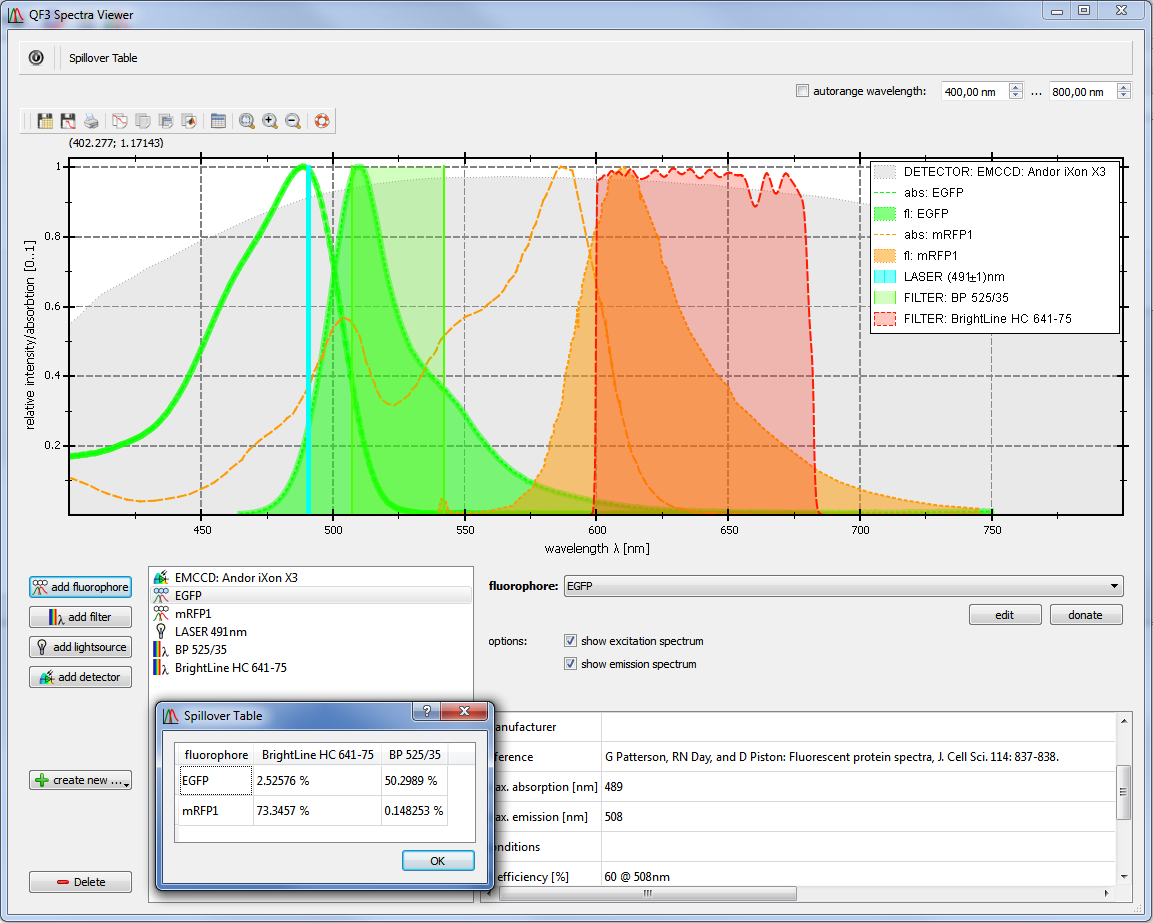
QF3_screen_spectra.png
added QuickFit3 screenshots
2019-01-12 14:21:18 +01:00
QF3_screen_tableplot.png
added QuickFit3 screenshots
2019-01-12 14:21:18 +01:00
README.md
using CMake now to build examples
2019-06-20 22:24:47 +02:00
rgbimageplot_cimg_small.png
added CImg interface (header-only) + examples
2019-11-16 13:50:43 +01:00
rgbimageplot_cimg.png
added CImg interface (header-only) + examples
2019-11-16 13:50:43 +01:00
rgbimageplot_cmy.png
using CMake now to build examples
2019-06-20 22:24:47 +02:00
rgbimageplot_opencv_small.png
using CMake now to build examples
2019-06-20 22:24:47 +02:00
rgbimageplot_opencv_updisdedown.png
using CMake now to build examples
2019-06-20 22:24:47 +02:00
rgbimageplot_opencv.png
using CMake now to build examples
2019-06-20 22:24:47 +02:00
rgbimageplot_qt_small.png
updated many documentation images to auto-generated ones
2022-08-28 22:48:14 +02:00
rgbimageplot_qt_updisdedown.png
using CMake now to build examples
2019-06-20 22:24:47 +02:00
rgbimageplot_qt.png
updated many documentation images to auto-generated ones
2022-08-28 22:48:14 +02:00
rgbimageplot_small.png
JKQTMathText:
2022-09-01 14:36:34 +02:00
rgbimageplot.png
JKQTMathText:
2022-09-01 14:36:34 +02:00
scatter_customsymbol_small.png
JKQTPlotter: added examples for custom symbols
2022-09-07 21:38:29 +02:00
scatter_customsymbol.png
JKQTPlotter: added examples for custom symbols
2022-09-07 21:38:29 +02:00
scatter_error_small.png
JKQTPlotter: added examples for custom symbols
2022-09-07 21:38:29 +02:00
scatter_error.png
JKQTPlotter: added examples for custom symbols
2022-09-07 21:38:29 +02:00
scatter_small.png
JKQTPlotter: added examples for custom symbols
2022-09-07 21:38:29 +02:00
scatter.png
JKQTPlotter: added examples for custom symbols
2022-09-07 21:38:29 +02:00
screen_barcharts.png
w
2015-07-11 17:47:57 +02:00
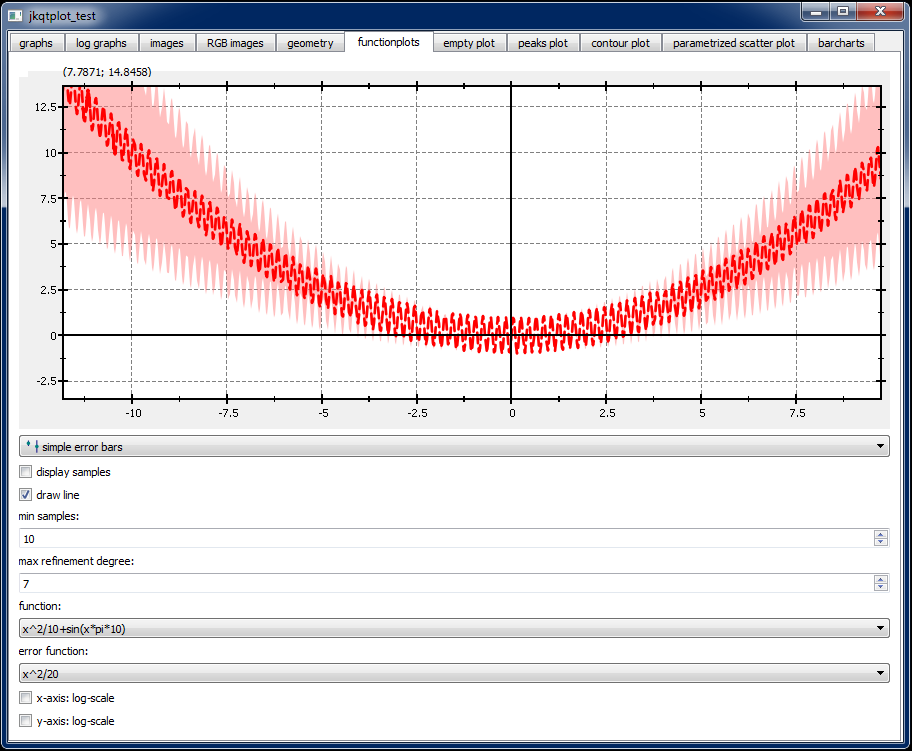
screen_functionplot.png
w
2015-07-11 17:47:57 +02:00
screen_images_latex.png
w
2015-07-11 18:06:49 +02:00
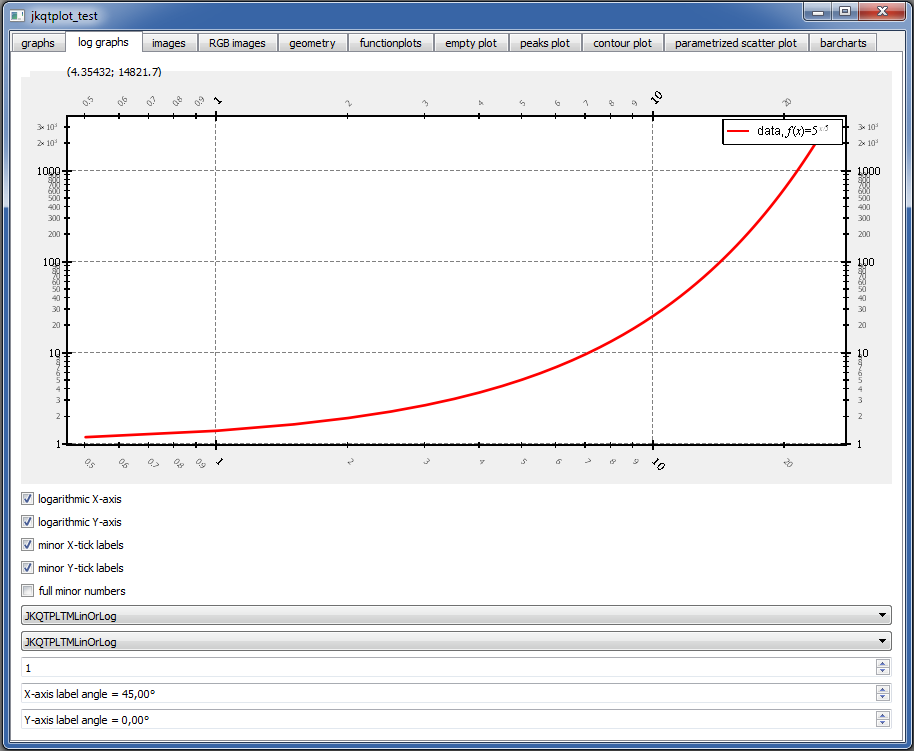
screen_loglog.png
w
2015-07-11 17:47:57 +02:00
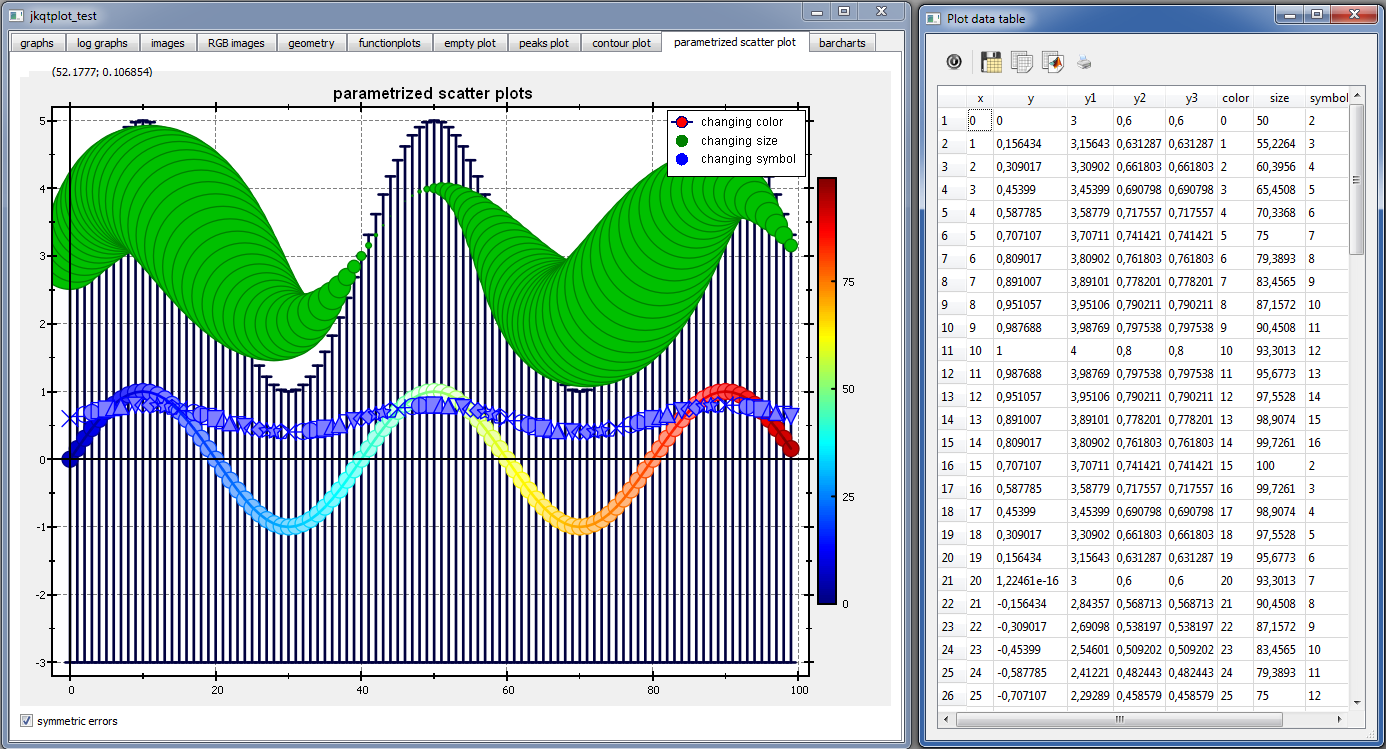
screen_parmetrizedplots_datatable.png
w
2015-07-11 17:47:57 +02:00
screen_scatter.png
w
2015-07-11 18:06:49 +02:00
screenshotsbanner.png
added missing documentation images
2019-01-12 14:08:32 +01:00
simpletest_small.png
JKQTMathText:
2022-09-01 14:36:34 +02:00
simpletest.png
JKQTMathText:
2022-09-01 14:36:34 +02:00
speed_contextmenu.png
bugfix+docfix
2022-08-25 17:25:23 +02:00
speed_small.png
using CMake now to build examples
2019-06-20 22:24:47 +02:00
speed.png
using CMake now to build examples
2019-06-20 22:24:47 +02:00
stackedbars_hor_small.png
JKQTMathText:
2022-09-01 14:36:34 +02:00
stackedbars_hor.png
JKQTMathText:
2022-09-01 14:36:34 +02:00
stackedbars_small.png
JKQTMathText:
2022-09-01 14:36:34 +02:00
stackedbars.png
JKQTMathText:
2022-09-01 14:36:34 +02:00
stepplots_small.png
JKQTPlotter: added examples for custom symbols
2022-09-07 21:38:29 +02:00
stepplots_vertical.png
using CMake now to build examples
2019-06-20 22:24:47 +02:00
stepplots.png
JKQTPlotter: added examples for custom symbols
2022-09-07 21:38:29 +02:00
stylesbanner.png
- added styling system for JKQTPlotter (+example app)
2019-02-09 12:43:12 +01:00
symbols_and_errors_small.png
JKQTMathText:
2022-09-01 14:36:34 +02:00
symbols_and_errors.png
JKQTMathText:
2022-09-01 14:36:34 +02:00
symbols_and_styles_small.png
updated many documentation images to auto-generated ones
2022-08-28 22:48:14 +02:00
symbols_and_styles.png
updated many documentation images to auto-generated ones
2022-08-28 22:48:14 +02:00
test_distributionplot_small.png
JKQTPlotter: added examples for custom symbols
2022-09-07 21:38:29 +02:00
test_distributionplot.png
JKQTPlotter: added examples for custom symbols
2022-09-07 21:38:29 +02:00
test_styledboxplot_small.png
updated many documentation images to auto-generated ones
2022-08-28 22:48:14 +02:00
test_styledboxplot.png
updated many documentation images to auto-generated ones
2022-08-28 22:48:14 +02:00
test_styling_small.png
- added styling system for JKQTPlotter (+example app)
2019-02-09 12:43:12 +01:00
test_styling.png
- added styling system for JKQTPlotter (+example app)
2019-02-09 12:43:12 +01:00
test_user_interaction.png
new: user-interaction tool that shows coordinates of data points near the current mouse position (when mouse is dragged, while mouse button is pressed)
2019-05-05 19:31:20 +02:00
ui_loglog.png
using CMake now to build examples
2019-06-20 22:24:47 +02:00
ui_small.png
using CMake now to build examples
2019-06-20 22:24:47 +02:00
ui_widget.png
using CMake now to build examples
2019-06-20 22:24:47 +02:00
ui.png
using CMake now to build examples
2019-06-20 22:24:47 +02:00
violinplot_hor_small.png
JKQTMathText:
2022-09-01 14:36:34 +02:00
violinplot_hor.png
JKQTPlotter: added examples for custom symbols
2022-09-07 21:38:29 +02:00
violinplot_small.png
using CMake now to build examples
2019-06-20 22:24:47 +02:00
violinplot_vert_small.png
JKQTPlotter: added examples for custom symbols
2022-09-07 21:38:29 +02:00
violinplot_vert.png
JKQTPlotter: added examples for custom symbols
2022-09-07 21:38:29 +02:00
wiggleplot_x_small.png
JKQTMathText:
2022-09-01 14:36:34 +02:00
wiggleplot_x.png
JKQTMathText:
2022-09-01 14:36:34 +02:00
wiggleplot_y_small.png
JKQTMathText:
2022-09-01 14:36:34 +02:00
wiggleplot_y.png
JKQTMathText:
2022-09-01 14:36:34 +02:00
wiggleplots_small.png
implemented wiggle plots (feature request #68 )
2022-05-11 22:55:23 +02:00
