mirror of
https://github.com/jkriege2/JKQtPlotter.git
synced 2025-01-12 17:00:32 +08:00
133 lines
5.4 KiB
Markdown
133 lines
5.4 KiB
Markdown
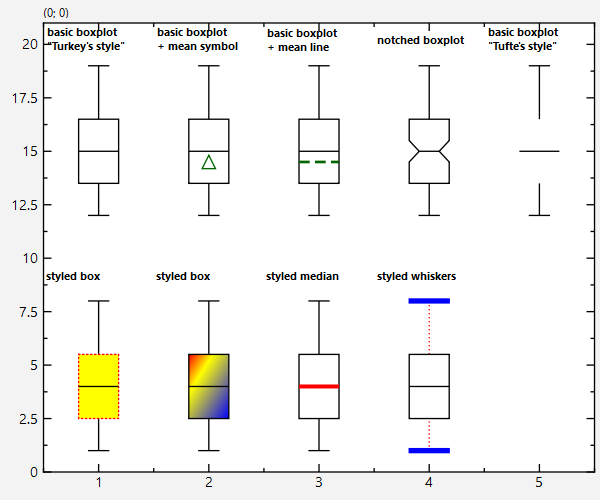
# Example (JKQTPlotter): Styling different aspects of boxplots {#JKQTPlotterBoxplotStyling}
|
|
This project (see [`test_styledboxplot`](https://github.com/jkriege2/JKQtPlotter/tree/master/examples/test_styledboxplot) demonstrates how to style different aspects of boxplots and how to draw different types and styles of boxplots. For a simple introduction into how to use boxplots, see [Plotting Box Plots](https://github.com/jkriege2/JKQtPlotter/tree/master/examples/boxplot) and [Plotting a Statistical Distribution of Data](https://github.com/jkriege2/JKQtPlotter/tree/master/examples/test_distributionplot).
|
|
|
|
[JKQTPlotterBasicJKQTPDatastore]: @ref JKQTPlotterBasicJKQTPDatastore "Basic Usage of JKQTPDatastore"
|
|
[JKQTPlotterBasicJKQTPDatastoreIterators]: @ref JKQTPlotterBasicJKQTPDatastoreIterators "Iterator-Based usage of JKQTPDatastore"
|
|
[JKQTPlotterBasicJKQTPDatastoreStatistics]: @ref JKQTPlotterBasicJKQTPDatastoreStatistics "Advanced 1-Dimensional Statistics with JKQTPDatastore"
|
|
[JKQTPlotterBasicJKQTPDatastoreRegression]: @ref JKQTPlotterBasicJKQTPDatastoreRegression "Regression Analysis (with the Statistics Library)"
|
|
[JKQTPlotterBasicJKQTPDatastoreStatistics2D]: @ref JKQTPlotterBasicJKQTPDatastoreStatistics2D "Advanced 2-Dimensional Statistics with JKQTPDatastore"
|
|
[statisticslibrary]: @ref jkqtptools_math_statistics "JKQTPlotter Statistics Library"
|
|
[JKQTPlotterBoxplotStyling]: @ref JKQTPlotterBoxplotStyling "Styling different aspects of boxplots"
|
|
[JKQTPlotterBoxplotsGraphs]: @ref JKQTPlotterBoxplotsGraphs "Boxplots"
|
|
|
|
***Note*** that this example explains how to style boxplots. The example [JKQTPlotterBoxplotsGraphs] explains basics of how to create boxplots. The internal [statisticslibrary] offers methods to calculate the statistical properties necessary for boxplots, which is explained in the tutorial [JKQTPlotterBasicJKQTPDatastoreStatistics] in detail.
|
|
|
|
|
|
|
|
The link http://vita.had.co.nz/papers/boxplots.pdf leads to a paper that described the history and different types of boxplots.
|
|
|
|
The source code of the main application can be found in [`test_styledboxplot.cpp`](test_styledboxplot.cpp).
|
|
The major parts that are concerned with the styling are:
|
|
|
|
```.cpp
|
|
// 2. create a basic boxplot
|
|
plot.addGraph(graphBoxPlot=new JKQTPBoxplotVerticalElement(&plot));
|
|
plot.addGraph(new JKQTPGeoText(&plot, x-dx/2.0, y0+9, "\\textbf{\\begin{matrix}basic boxplot\\\\\"Turkey's style\"\\end{matrix}}", 8, QColor("black")));
|
|
graphBoxPlot->setPos(x);
|
|
graphBoxPlot->setMin(y0+1);
|
|
graphBoxPlot->setPercentile25(y0+2.5);
|
|
graphBoxPlot->setMedian(y0+4);
|
|
graphBoxPlot->setPercentile75(y0+5.5);
|
|
graphBoxPlot->setMax(y0+8);
|
|
// set color of all elements
|
|
graphBoxPlot->setBoxplotColor(QColor("black"),QColor("white"), plot.getPlotter());
|
|
|
|
// ...
|
|
// ...
|
|
|
|
// 3. create a basic boxplot with mean as symbol
|
|
// ...
|
|
// set mean value to show mean symbol
|
|
graphBoxPlot->setMean(y0+3.5);
|
|
graphBoxPlot->setDrawMean(true);
|
|
graphBoxPlot->setMeanMode(JKQTPGraphBoxplotStyleMixin::MeanAsSymbol);
|
|
graphBoxPlot->setMeanColor(QColor("darkgreen"));
|
|
graphBoxPlot->setMeanSymbolType(JKQTPFilledTriangle);
|
|
|
|
// ...
|
|
// ...
|
|
|
|
// 4. create a basic boxplot with mean as line
|
|
// ...
|
|
// set mean value to show mean symbol
|
|
graphBoxPlot->setMean(y0+3.5);
|
|
graphBoxPlot->setDrawMean(true);
|
|
graphBoxPlot->setMeanMode(JKQTPGraphBoxplotStyleMixin::MeanAsLine);
|
|
graphBoxPlot->setMeanColor(QColor("darkgreen"));
|
|
graphBoxPlot->setMeanLineStyle(Qt::DashLine);
|
|
graphBoxPlot->setMeanLineWidth(2);
|
|
|
|
// ...
|
|
// ...
|
|
|
|
// 5. create a notched boxplot
|
|
// ...
|
|
// for a notched plot, you need to set the confidence interval
|
|
graphBoxPlot->setMedianConfidenceIntervalWidth(1);
|
|
graphBoxPlot->setDrawNotch(true);
|
|
graphBoxPlot->setRelativeNotchIndent(y0+0.5);
|
|
|
|
// ...
|
|
// ...
|
|
|
|
// 6. create a notched boxplot
|
|
// ...
|
|
// restyle as Tufte's box-less
|
|
graphBoxPlot->setDrawBox(false);
|
|
|
|
// ...
|
|
// ...
|
|
|
|
// 7. style box
|
|
// ...
|
|
// style box line&fill
|
|
graphBoxPlot->setLineColor(QColor("red"));
|
|
graphBoxPlot->setLineStyle(Qt::DotLine);
|
|
graphBoxPlot->setLineWidth(1);
|
|
graphBoxPlot->setFillColor(QColor("yellow"));
|
|
|
|
// ...
|
|
// ...
|
|
|
|
// 8. fancy style box
|
|
// ...
|
|
// style box fill
|
|
QLinearGradient linearGrad(QPointF(0, 0), QPointF(1, 1));
|
|
QColor c1(Qt::red);
|
|
QColor c2(Qt::yellow);
|
|
QColor c3(Qt::blue);
|
|
linearGrad.setColorAt(0, c1);
|
|
linearGrad.setColorAt(0.3, c2);
|
|
linearGrad.setColorAt(1, c3);
|
|
// use this CoordinateMode, so the gradient fills the whole graph area
|
|
linearGrad.setCoordinateMode(QGradient::ObjectBoundingMode);
|
|
graphBoxPlot->setFillGradient(linearGrad);
|
|
|
|
// ...
|
|
// ...
|
|
|
|
// 9. style median
|
|
// ...
|
|
// style box line
|
|
graphBoxPlot->setMedianLineColor(QColor("red"));
|
|
graphBoxPlot->setMedianLineWidth(3);
|
|
|
|
// ...
|
|
// ...
|
|
|
|
// 10. style whiskers&caps
|
|
// ...
|
|
// style box line
|
|
graphBoxPlot->setWhiskerLineColor(QColor("red"));
|
|
graphBoxPlot->setWhiskerLineStyle(Qt::DotLine);
|
|
graphBoxPlot->setWhiskerLineWidth(1);
|
|
graphBoxPlot->setWhiskerCapLineColor(QColor("blue"));
|
|
graphBoxPlot->setWhiskerCapLineStyle(Qt::SolidLine);
|
|
graphBoxPlot->setWhiskerCapLineWidth(4);
|
|
graphBoxPlot->setRelativeWhiskerWidth(0.9);
|
|
```
|
|
|
|
The result looks like this:
|
|
|
|

|