mirror of
https://github.com/jkriege2/JKQtPlotter.git
synced 2024-11-16 10:35:49 +08:00
116 lines
6.1 KiB
Markdown
116 lines
6.1 KiB
Markdown
[Back to JKQTPlotter main page](https://github.com/jkriege2/JKQtPlotter/)
|
||
|
||
# JKQtPlotter
|
||
|
||
## Simple stacked barchart
|
||
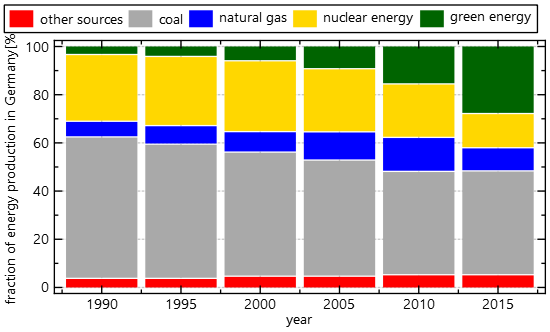
This project (see `./test/simpletest_stackedbars/`) simply creates a JKQtPlotter widget (as a new window) and adds several stacked barcharts.
|
||
|
||
The soruce code of the main application is (see [`jkqtplotter_simpletest_stackedbars.cpp´](https://github.com/jkriege2/JKQtPlotter/blob/master/test/simpletest_stackedbars/jkqtplotter_simpletest_stackedbars.cpp):
|
||
```c++
|
||
#include <QApplication>
|
||
#include "jkqtplotter/jkqtplotter.h"
|
||
#include "jkqtplotter/jkqtpbarchartelements.h"
|
||
|
||
#define Ndata 5
|
||
int main(int argc, char* argv[])
|
||
{
|
||
QApplication app(argc, argv);
|
||
|
||
// 1. create a plotter window and get a pointer to the internal datastore (for convenience)
|
||
JKQtPlotter plot;
|
||
plot.get_plotter()->set_useAntiAliasingForGraphs(true); // nicer (but slower) plotting
|
||
plot.get_plotter()->set_useAntiAliasingForSystem(true); // nicer (but slower) plotting
|
||
plot.get_plotter()->set_useAntiAliasingForText(true); // nicer (but slower) text rendering
|
||
JKQTPdatastore* ds=plot.getDatastore();
|
||
|
||
// 2. now we create data for the charts (taken from https://commons.wikimedia.org/wiki/File:Energiemix_Deutschland.svg)
|
||
QVector<double> year, percentage_other, percentage_coaloil, percentage_gas, percentage_nuclear, percentage_green;
|
||
year << 1990 << 1995 << 2000 << 2005 << 2010 << 2015;
|
||
percentage_other << 3.5 << 3.5 << 4.4 << 4.4 << 5 << 5 ;
|
||
percentage_coaloil << 58.7 << 55.7 << 51.5 << 48.2 << 42.9 << 43.1;
|
||
percentage_gas << 6.5 << 7.7 << 8.5 << 11.7 << 14.1 << 9.6 ;
|
||
percentage_nuclear << 27.7 << 28.7 << 29.4 << 26.2 << 22.2 << 14.2;
|
||
percentage_green << 3.6 << 4.4 << 6.2 << 9.5 << 15.8 << 28.1;
|
||
|
||
|
||
// 3. make data available to JKQtPlotter by adding it to the internal datastore.
|
||
// Note: In this step the data is copied (of not specified otherwise)
|
||
// the variables cYear, cOther ... will contain the internal column ID of the
|
||
// newly created columns with names "year" and "other" ... and the (copied) data
|
||
size_t cYear=ds->addCopiedColumn(year, "year");
|
||
size_t cOther=ds->addCopiedColumn(percentage_other, "other");
|
||
size_t cCoalOil=ds->addCopiedColumn(percentage_coaloil, "coal & oil");
|
||
size_t cGas=ds->addCopiedColumn(percentage_gas, "natural gas");
|
||
size_t cNuclear=ds->addCopiedColumn(percentage_nuclear, "nuclear energy");
|
||
size_t cGreen=ds->addCopiedColumn(percentage_green, "green energy");
|
||
|
||
// 4. create graphs in the plot, which plots the dataset year/other, year/coal, ...
|
||
// The color of the graphs is set by calling set_fillColor_and_darkenedColor(), which sets the
|
||
// fillColor to the given color and makes the outline of the bars (i.e. their "color") a darker
|
||
// shade of the given color.
|
||
QVector<JKQTPbarVerticalStackableGraph*> graphs;
|
||
graphs.push_back(new JKQTPbarVerticalStackableGraph(&plot));
|
||
graphs.back()->set_xColumn(cYear);
|
||
graphs.back()->set_yColumn(cOther);
|
||
graphs.back()->set_title(QObject::tr("other sources"));
|
||
graphs.back()->set_fillColor_and_darkenedColor(QColor("red"));
|
||
graphs.push_back(new JKQTPbarVerticalStackableGraph(&plot));
|
||
graphs.back()->set_xColumn(cYear);
|
||
graphs.back()->set_yColumn(cCoalOil);
|
||
graphs.back()->set_title(QObject::tr("coal & oil"));
|
||
graphs.back()->set_fillColor_and_darkenedColor(QColor("darkgrey"));
|
||
graphs.back()->stackUpon(graphs[graphs.size()-2]);
|
||
graphs.push_back(new JKQTPbarVerticalStackableGraph(&plot));
|
||
graphs.back()->set_xColumn(cYear);
|
||
graphs.back()->set_yColumn(cGas);
|
||
graphs.back()->set_title(QObject::tr("natural gas"));
|
||
graphs.back()->set_fillColor_and_darkenedColor(QColor("blue"));
|
||
graphs.back()->stackUpon(graphs[graphs.size()-2]);
|
||
graphs.push_back(new JKQTPbarVerticalStackableGraph(&plot));
|
||
graphs.back()->set_xColumn(cYear);
|
||
graphs.back()->set_yColumn(cNuclear);
|
||
graphs.back()->set_title(QObject::tr("nuclear energy"));
|
||
graphs.back()->set_fillColor_and_darkenedColor(QColor("gold"));
|
||
graphs.back()->stackUpon(graphs[graphs.size()-2]);
|
||
graphs.push_back(new JKQTPbarVerticalStackableGraph(&plot));
|
||
graphs.back()->set_xColumn(cYear);
|
||
graphs.back()->set_yColumn(cGreen);
|
||
graphs.back()->set_title(QObject::tr("green energy"));
|
||
graphs.back()->set_fillColor_and_darkenedColor(QColor("darkgreen"));
|
||
graphs.back()->stackUpon(graphs[graphs.size()-2]);
|
||
|
||
|
||
// 5. add the graphs to the plot, so it is actually displayed
|
||
plot.addGraphs(graphs);
|
||
|
||
// 6. set axis labels
|
||
plot.get_xAxis()->set_axisLabel("year");
|
||
plot.get_yAxis()->set_axisLabel("fraction of energy production in Germany [%]");
|
||
|
||
// 7. finally we move the plot key/legend to the outside, top-right
|
||
// and lay it out as a single row
|
||
// NOTE: plot is a descendent of QWidget, which uses an internal object of
|
||
// type JKQTBasePlotter, which does the actual plotting.
|
||
// So many properties of the plot are only available in this internal
|
||
// object, which you can access by plot.get_plotter().
|
||
plot.get_plotter()->set_keyPosition(JKQTPkeyOutsideTopRight);
|
||
plot.get_plotter()->set_keyLayout(JKQTPkeyLayoutOneRow);
|
||
|
||
// 8 autoscale the plot so the graph is contained
|
||
plot.zoomToFit();
|
||
|
||
// show plotter and make it a decent size
|
||
plot.show();
|
||
plot.resize(600,400);
|
||
|
||
return app.exec();
|
||
}
|
||
```
|
||
The result looks like this:
|
||
|
||

|
||
|
||
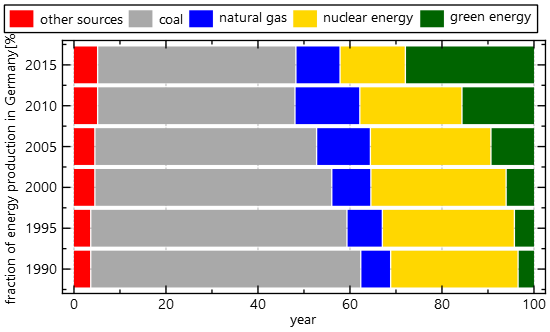
If you use `JKQTPbarHorizontalGraphStacked` instead of `JKQTPbarVerticalStackableGraph`, you'll get a result like this:
|
||

|
||
|
||
[Back to JKQTPlotter main page](https://github.com/jkriege2/JKQtPlotter/) |