mirror of
https://github.com/jkriege2/JKQtPlotter.git
synced 2025-01-13 17:22:11 +08:00
48 lines
2.8 KiB
Markdown
48 lines
2.8 KiB
Markdown
[Back to JKQTPlotter main page](https://github.com/jkriege2/JKQtPlotter/)
|
|
|
|
# JKQTPlotter Screenshots
|
|
## Scatter Plots and Boxplots
|
|

|
|
|
|
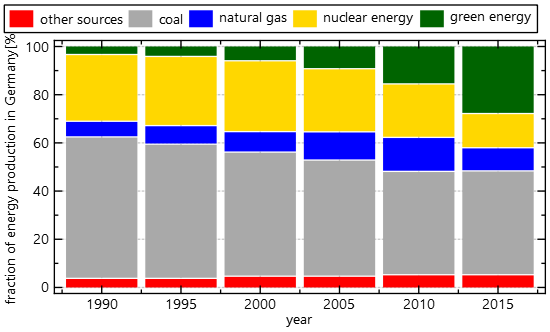
## Different Types of Barcharts
|
|

|
|
|
|
## Image Plots
|
|
You can plot C-arrays as images in different color-coding styles. Diferent Overlays/masks are also available. Finally you can use LaTeX markup to format any axis/plot/tick/... label. there is an internal LaTeX parser in this package.
|
|
|
|

|
|
|
|

|
|
|
|
|
|
## Plotting a user-defined (parsed) function
|
|
Yes, a complete math expression parser is contained!
|
|

|
|
|
|
## Axis-Label styles in LogLog-Plot
|
|

|
|
|
|
|
|
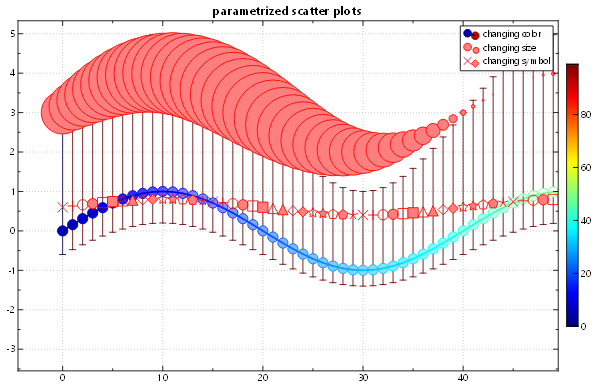
## Parametrized Scatter Plots and Data Viewer
|
|
Scatter Plots can have symbols where the shape/color/size is parametrized by a data column. Also the plotter is built around an internal datastore, which you can access (readonly!!!) by a data-viewer that is accessible from the contextmenu in any plot.
|
|
|
|
|
|
|
|
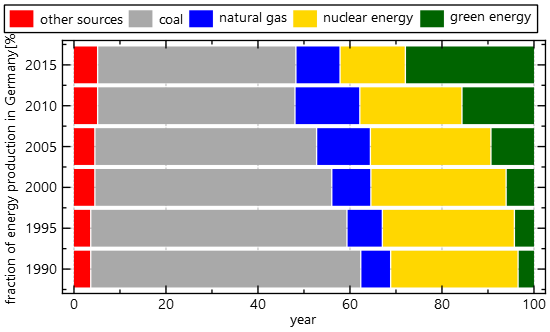
## Barcharts
|
|
|
|
|
|
|
|

|
|
|
|
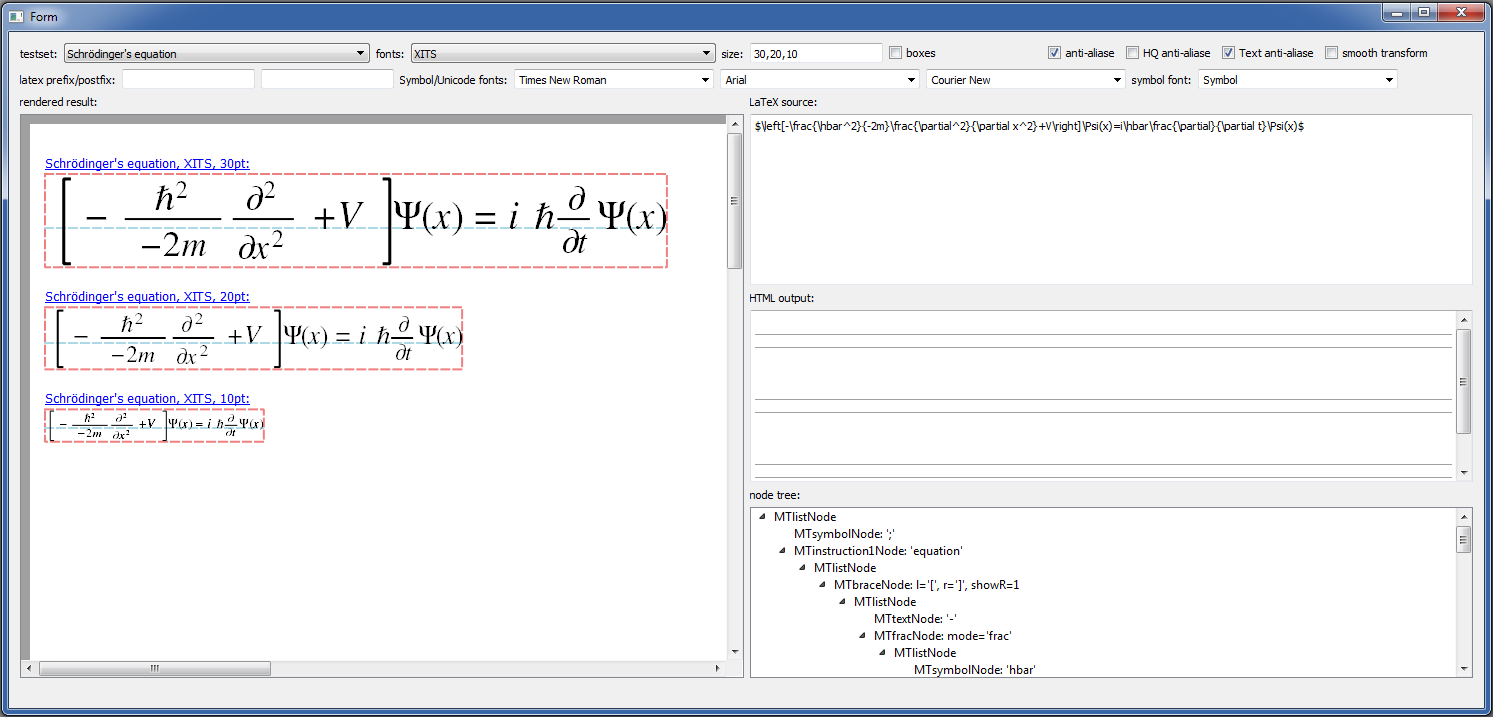
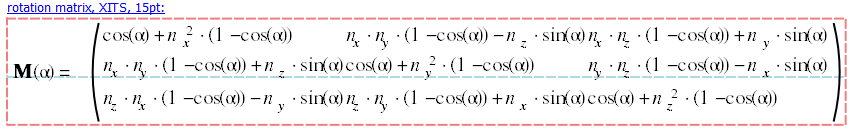
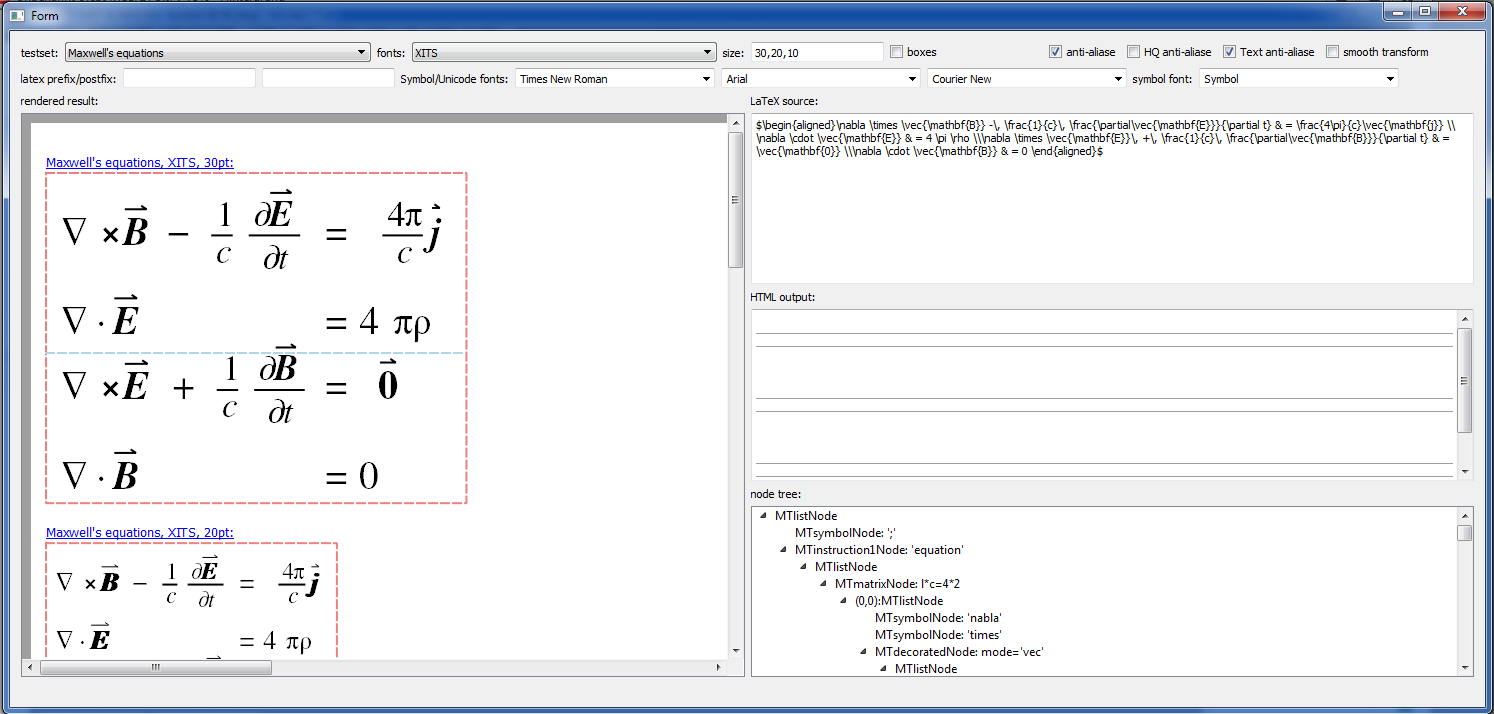
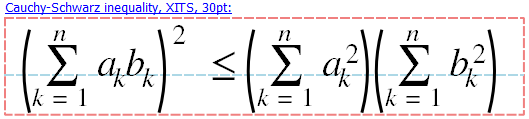
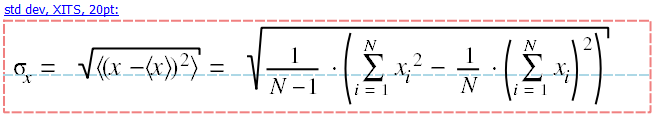
## Screenshots of included LaTeX renderer
|
|
|
|
|
|
|
|
|
|
|
|
|
|
|
|
|
|
[Back to JKQTPlotter main page](https://github.com/jkriege2/JKQtPlotter/)
|
|
|