mirror of
https://github.com/jkriege2/JKQtPlotter.git
synced 2024-11-15 18:15:52 +08:00
28 lines
1.3 KiB
Markdown
28 lines
1.3 KiB
Markdown
|
|
# Example (JKQTPlotter): Financial Chart (Candlestick/OHLC) Example {#JKQTPlotterFinancialChartExample}
|
||
|
|
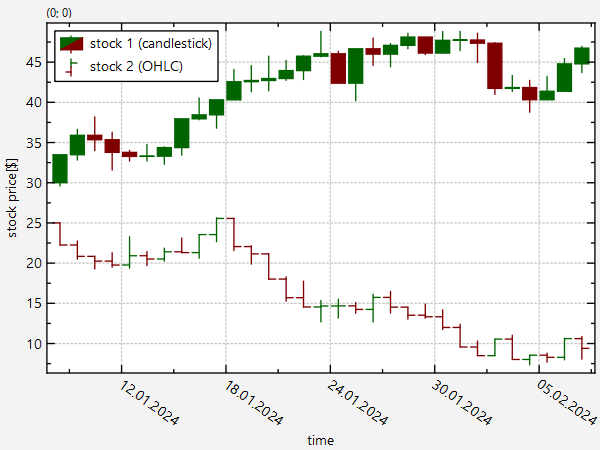
This project (see [`financialgraphs`](https://github.com/jkriege2/JKQtPlotter/tree/master/examples/financialgraphs) demonstrates the use of JKQTPFinancialGraph to visualize financial data (i.e. market price development of stocks, derivatives, ...).
|
||
|
|
|
||
|
|
The source code of the main application is (see [`financialgraphs.cpp`](https://github.com/jkriege2/JKQtPlotter/tree/master/examples/financialgraphs/financialgraphs.cpp).
|
||
|
|
|
||
|
|
Here is a short summary of the important parts of the code:
|
||
|
|
|
||
|
|
```.cpp
|
||
|
|
```
|
||
|
|
|
||
|
|
|
||
|
|
The result looks like this:
|
||
|
|
|
||
|
|

|
||
|
|
|
||
|
|
|
||
|
|
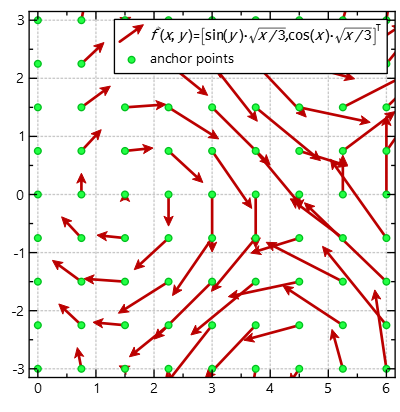
By default, the length of the drawn vector is determined from the actual length in the data via an autoscaling algorithm that is supposed to prevent the vectors from overlapping.
|
||
|
|
But you can modify this behaviour by adding a line
|
||
|
|
|
||
|
|
```.cpp
|
||
|
|
graph1->setVectorLengthMode(JKQTPVectorFieldGraph::LengthFromData);
|
||
|
|
```
|
||
|
|
|
||
|
|
which will use the given lengths directly (only scaled by an optional factor defined by JKQTPVectorFieldGraph::setLengthScaleFactor() ). The result then looks like this:
|
||
|
|
|
||
|
|

|
||
|
|
|