mirror of
https://github.com/jkriege2/JKQtPlotter.git
synced 2025-02-03 11:09:20 +08:00
| .. | ||
| CMakeLists.txt | ||
| financialgraphs.cpp | ||
| README.md | ||
Example (JKQTPlotter): Financial Chart (Candlestick/OHLC) Example
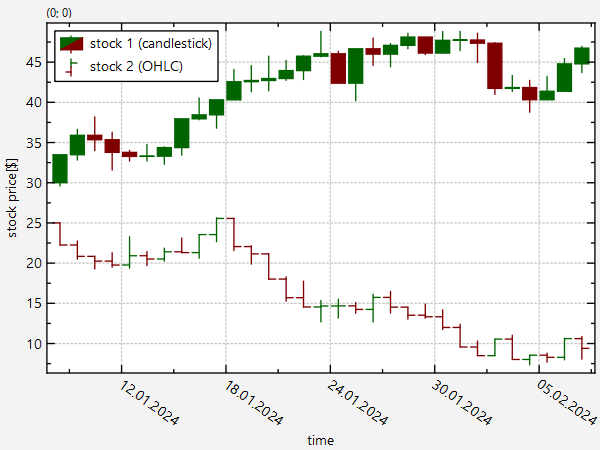
This project (see financialgraphs demonstrates the use of JKQTPFinancialGraph to visualize financial data (i.e. market price development of stocks, derivatives, ...).
The source code of the main application is (see financialgraphs.cpp.
Here is a short summary of the important parts of the code:
The result looks like this:
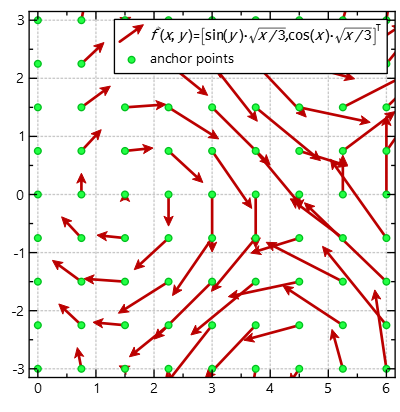
By default, the length of the drawn vector is determined from the actual length in the data via an autoscaling algorithm that is supposed to prevent the vectors from overlapping. But you can modify this behaviour by adding a line
graph1->setVectorLengthMode(JKQTPVectorFieldGraph::LengthFromData);
which will use the given lengths directly (only scaled by an optional factor defined by JKQTPVectorFieldGraph::setLengthScaleFactor() ). The result then looks like this:

