| .. | ||
| CMakeLists.txt | ||
| README.md | ||
| second_axis.cpp | ||
Example (JKQTPlotter): Secondary Axes
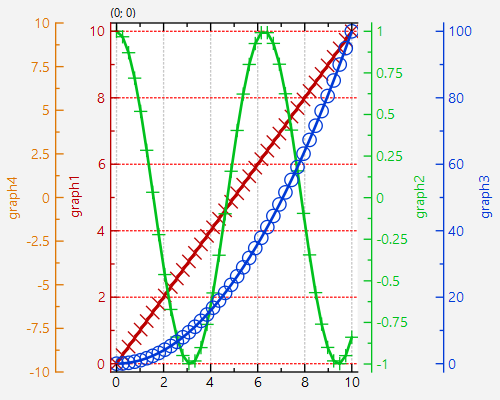
This project (see second_axis shows how to plot with multiple axes.
The source code of the main application is (see second_axis.cpp.
In the code we take these step to set up a plot with two secondary axes and three graphs:
1./2. create a plotter and create columns with different dataset:
    // 1. create a plotter window and get a pointer to the internal datastore (for convenience)
    JKQTPDatastore* ds=plot.getDatastore();

    // 2. now we create two columns for key and value
    size_t columnX=ds->addLinearColumn(40, 0,10,"x");
    size_t columnY1=ds->addColumnCalculatedFromColumn(columnX, [](double x) { return x; }, "y1");
    size_t columnY2=ds->addColumnCalculatedFromColumn(columnX, [](double x) { return cos(x); }, "y2");
    size_t columnY3=ds->addColumnCalculatedFromColumn(columnX, [](double x) { return x*x; }, "y3");
    size_t columnY4=ds->addColumnCalculatedFromColumn(columnX, [](double x) { return sqrt(x); }, "y3");
- create a second y-axis and set its formating options, so it only draws an axis on the right
    auto yAxisRef2=plot.getPlotter()->addSecondaryYAxis(new JKQTPVerticalAxis(plot.getPlotter(), JKQTPPrimaryAxis));
    plot.getYAxis(yAxisRef2)->setDrawGrid(false);
    plot.getYAxis(yAxisRef2)->setDrawMode1(JKQTPCADMnone);
    plot.getYAxis(yAxisRef2)->setDrawMode2(JKQTPCADMcomplete);
    plot.getYAxis(yAxisRef2)->setDrawMode0(JKQTPCADMnone);
    plot.getYAxis(yAxisRef2)->setShowZeroAxis(false);
... and create third y-axis
    auto yAxisRef3=plot.getPlotter()->addSecondaryYAxis(new JKQTPVerticalAxis(plot.getPlotter(), JKQTPPrimaryAxis));
    plot.getYAxis(yAxisRef3)->setDrawGrid(false);
    plot.getYAxis(yAxisRef3)->setDrawMode1(JKQTPCADMnone);
    plot.getYAxis(yAxisRef3)->setDrawMode2(JKQTPCADMcomplete);
    plot.getYAxis(yAxisRef3)->setDrawMode0(JKQTPCADMnone);
    plot.getYAxis(yAxisRef3)->setShowZeroAxis(false);
... and a fourth y-axis (on the primary side)
    auto yAxisRef4=plot.getPlotter()->addSecondaryYAxis(new JKQTPVerticalAxis(plot.getPlotter(), JKQTPPrimaryAxis));
    plot.getYAxis(yAxisRef4)->setDrawGrid(false);
    plot.getYAxis(yAxisRef4)->setDrawMode1(JKQTPCADMcomplete);
    plot.getYAxis(yAxisRef4)->setDrawMode2(JKQTPCADMnone);
    plot.getYAxis(yAxisRef4)->setDrawMode0(JKQTPCADMnone);
    plot.getYAxis(yAxisRef4)->setShowZeroAxis(false);
... reformat the major y-axis, so it does not draw on the right and thus the secondary axis yAxisRef2 replaces it there. If this step is omitted, the secondary axes stack on the right of the primary.
    plot.getYAxis()->setDrawMode2(JKQTPCADMnone);
    plot.getYAxis()->setColor(graph1->getLineColor());
- create graph in the plot, which plots the dataset:
3.1 the first graph uses the default (primary) x/y-axes
    JKQTPXYLineGraph* graph1=new JKQTPXYLineGraph(&plot);
    graph1->setKeyColumn(columnX);
    graph1->setValueColumn(columnY1);
    plot.addGraph(graph1);
    plot.getYAxis()->setAxisLabel("graph1");
3.2 the second graph uses the default (primary) x-axis, but the secondary axis yAxisRef2 as y-axis
    JKQTPXYLineGraph* graph2=new JKQTPXYLineGraph(&plot);
    graph2->setKeyColumn(columnX);
    graph2->setValueColumn(columnY2);
    plot.addGraph(graph2);
tell graph2 to use this axis
graph2->setYAxis(yAxisRef2);
set axis color to match graph2's color
plot.getYAxis(yAxisRef2)->setColor(graph2->getLineColor());
set axis label
plot.getYAxis(yAxisRef2)->setAxisLabel("graph2");
3.3 the third graph uses the default (primary) x-axis, but the secondary axis yAxisRef3 as y-axis
    JKQTPXYLineGraph* graph3=new JKQTPXYLineGraph(&plot);
    graph3->setKeyColumn(columnX);
    graph3->setValueColumn(columnY3);
    plot.addGraph(graph3);
    plot.getYAxis(yAxisRef3)->setColor(graph3->getLineColor());
    plot.getYAxis(yAxisRef3)->setAxisLabel("graph3");
    graph3->setYAxis(yAxisRef3);
3.5 the fourth graph uses the default (primary) x-axis, but the secondary axis yAxisRef4 as y-axis
    JKQTPXYLineGraph* graph4=new JKQTPXYLineGraph(&plot);
    graph4->setKeyColumn(columnX);
    graph4->setValueColumn(columnY4);
    plot.addGraph(graph3);
    plot.getYAxis(yAxisRef4)->setColor(graph4->getLineColor());
    plot.getYAxis(yAxisRef4)->setAxisLabel("graph4");
    graph4->setYAxis(yAxisRef4);
- autoscale the plot so the graph is contained. This auto-scales all axes using the graphs (and their data) as assigned to the axes, i.e.:
- all 3 graphs for x-axis,
- graph1 for primary y-axis,
- graph2 for secondary axis yAxisRef2
- graph3 for secondary axis yAxisRef3
- graph4 for secondary axis yAxisRef4 .
plot.zoomToFit();
- show plotter and make it a decent size
    plot.setWindowTitle(title);
    plot.show();
    plot.resize(500,400);
The result looks like this:
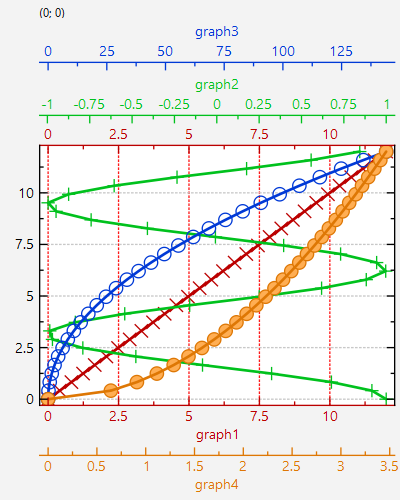
If we set seondary axes for the x-axis instead of the y-axis, i.e. use
    // ...
    auto xAxisRef2=plot.getPlotter()->addSecondaryXAxis(new JKQTPHorizontalAxis(plot.getPlotter(), JKQTPPrimaryAxis));
    // ...
we get a plot like this:

