mirror of
https://github.com/jkriege2/JKQtPlotter.git
synced 2025-02-24 17:31:47 +08:00
| .. | ||
| CMakeLists.txt | ||
| geo_bezier.cpp | ||
| README.md | ||
Example (JKQTPlotter): Plotting Bezier Curves
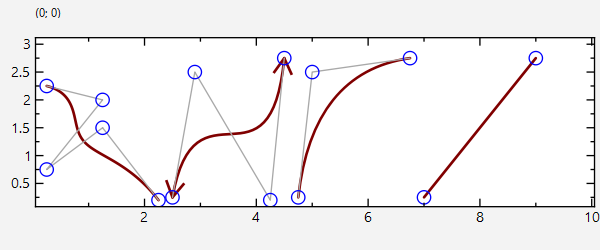
This project shows the capabilities of JKQTPlotter to also draw arrows as geometric elements, using JKQTPGeoBezierCurve.
The source code of the main application can be found in geo_bezier.cpp. First a plot is generated. Then several types of bezier curves are added to the plot and their control points shown.
Here is an example for drawing a cubic bézier curve:
    JKQTPGeoBezierCurve* bezCubic=new JKQTPGeoBezierCurve(&plot);
    bezCubic->setCubic(QPointF(0.25,0.25), QPointF(0.8,2.5), QPointF(3.25,0.2), QPointF(3.75,2.75));
    bezCubic->setLineColor(QColor("maroon"));
    bezCubic->setHeadDecoratorSizeFactor(JKQTPArrow);
    bezCubic->setTailDecoratorSizeFactor(JKQTPArrow);
    plot.addGraph(bezCubic);
Finally we also add symbols for each control point and a poly-line connecting them:
    JKQTPGeoPolyLines* l2;
    plot.addGraph(l2=new JKQTPGeoPolyLines(&plot, bezCubic->getPoints()));
    l2->setLineColor(QColor("darkgrey"));
    l2->setLineWidth(1);
    JKQTPXYScatterGraph* scatCubic=new JKQTPXYScatterGraph(&plot);
    scatCubic->setXYColumns(plot.getDatastore()->addCopiedPoints(bezCubic->getPoints()));
    scatCubic->setSymbolColor(QColor("blue"));
    scatCubic->setSymbolType(JKQTPCircle);
    plot.addGraph(scatCubic);
Here is the resulting plot:
