mirror of
https://github.com/jkriege2/JKQtPlotter.git
synced 2025-02-24 17:31:47 +08:00
NEW/BREAKING: refactor CMake-Code, so static/dynamic switch is done via <code>BUILD_SHARED_LIBS</code>, which retires <code>JKQtPlotter_BUILD_STATIC_LIBS</code>, <code>JKQtPlotter_BUILD_SHARED_LIBS</code> and removes the capability to build static and shared libraries in one location (fixes issue #104) NEW: prepareed library for CMake's <a href="https://cmake.org/cmake/help/latest/module/FetchContent.html">FetchContent</a>-API NEW: the different sub-libraries JKQTPlotter, JKQTFastPlotter (DEPRECATED), JKQTMath, JKQTMathText can be activated/deactivated with CMake options JKQtPlotter_BUILD_LIB_JKQTPLOTTER, JKQtPlotter_BUILD_LIB_JKQTFASTPLOTTER, JKQtPlotter_BUILD_LIB_JKQTMATHTEXT, JKQtPlotter_BUILD_LIB_JKQTMATH |
||
|---|---|---|
| .. | ||
| CMakeLists.txt | ||
| geo_coordinateaxis0.cpp | ||
| README.md | ||
Example (JKQTPlotter): Plot With Axes through Origin
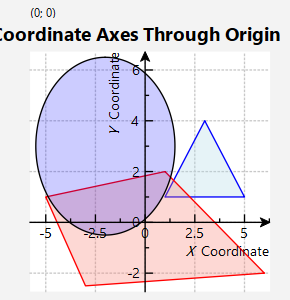
This example draws a coordinate system with several geomtric shapes, where the coordinate axes pass through the origin of the plot, not at the borders. Note that if you move the displayed coordinate ranges, so 0 is not in them, the axes still stick to the borders.
The source code of the main application can be found in geo_coordinateaxis0.cpp.
Apart from the usual code to set up the graphs, the following fragment switches the "normal" axes at the borders off and the zero axis on:
    plot.getXAxis()->setShowZeroAxis(false);
    plot.getYAxis()->setShowZeroAxis(false);
    plot.getXAxis()->setDrawMode1(JKQTPCADMnone);
    plot.getXAxis()->setDrawMode2(JKQTPCADMnone);
    plot.getXAxis()->setDrawMode0(JKQTPCADMcomplete|JKQTPCADMMaxFilledArrow);
    plot.getXAxis()->setLabelPosition(JKQTPLabelMax);
    plot.getXAxis()->setAxisLabel("$X$ Coordinate");
    plot.getYAxis()->setDrawMode1(JKQTPCADMnone);
    plot.getYAxis()->setDrawMode2(JKQTPCADMnone);
    plot.getYAxis()->setDrawMode0(JKQTPCADMcomplete|JKQTPCADMMaxFilledArrow);
    plot.getYAxis()->setLabelPosition(JKQTPLabelMax);
    plot.getYAxis()->setAxisLabel("$Y$ Coordinate");
The axes are configured to have an arrow at their max end (|JKQTPCADMMaxFilledArrow) and the axis label is also positioned close to the axis max.
The resulting plot looks like this:
