mirror of
https://github.com/jkriege2/JKQtPlotter.git
synced 2025-01-27 16:09:15 +08:00
NEW/BREAKING: refactor CMake-Code, so static/dynamic switch is done via <code>BUILD_SHARED_LIBS</code>, which retires <code>JKQtPlotter_BUILD_STATIC_LIBS</code>, <code>JKQtPlotter_BUILD_SHARED_LIBS</code> and removes the capability to build static and shared libraries in one location (fixes issue #104) NEW: prepareed library for CMake's <a href="https://cmake.org/cmake/help/latest/module/FetchContent.html">FetchContent</a>-API NEW: the different sub-libraries JKQTPlotter, JKQTFastPlotter (DEPRECATED), JKQTMath, JKQTMathText can be activated/deactivated with CMake options JKQtPlotter_BUILD_LIB_JKQTPLOTTER, JKQtPlotter_BUILD_LIB_JKQTFASTPLOTTER, JKQtPlotter_BUILD_LIB_JKQTMATHTEXT, JKQtPlotter_BUILD_LIB_JKQTMATH |
||
|---|---|---|
| .. | ||
| barchart_customdrawfunctor.cpp | ||
| CMakeLists.txt | ||
| README.md | ||
Example (JKQTPlotter): Barchart With Custom Draw Functor
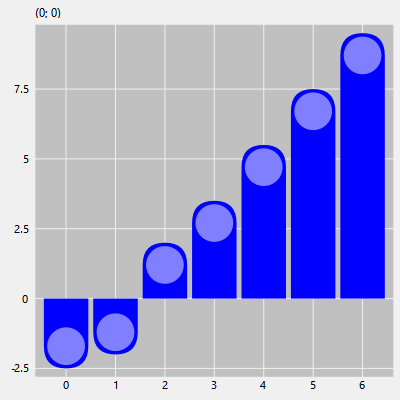
This project (see barchart_customdrawfunctor shows how to draw customized barcharts, with a custom draw functor.
The source code of the main application is (see barchart_customdrawfunctor.cpp:
    // 1. create a plotter window and get a pointer to the internal datastore (for convenience)
    JKQTPDatastore* ds=plot.getDatastore();

    // 2. now we create two columns for key and value
    size_t columnK=ds->addLinearColumn(7, 0, 6, "k");
    size_t columnV=ds->addColumnCalculatedFromColumn(columnK, [](double x) { return jkqtp_sign(2.0*x-2.5)*qMax(2.0,fabs(2.0*x-2.5)); }, "v");

    // 3. load a stylesheet
    plot.loadCurrentPlotterStyle(QSettings(":/JKQTPlotter/styles/seaborn.ini", QSettings::IniFormat));

    // 4. create graph in the plot, which plots the dataset:
    JKQTPBarVerticalGraph* graph=new JKQTPBarVerticalGraph(&plot);
    graph->setKeyColumn(columnK);
    graph->setValueColumn(columnV);
    // this is the custom draw functor
    graph->setCustomDrawingFunctor(
    [](JKQTPEnhancedPainter& painter, const QRectF& bar_px, const QPointF& datapoint, Qt::Orientation orientation, JKQTPBarGraphBase* graph) {
        painter.save();
        painter.setPen(Qt::NoPen);
        QBrush b=painter.brush();
        QBrush bDeco=b;
        bDeco.setColor(b.color().lighter());
        // we draw the bar with a rounded end and add a lightly colored circle near the top
        if (orientation==Qt::Vertical) {
            // for vertical barcharts
            const double dx=bar_px.width()/2.0;
            const double r=dx*0.85;
            // depending in whether the bar elongates above or below the baseline,
            // we have to align the circle wrt the top or the bottom of the rectangle bar_px
            if (datapoint.y()>=graph->getBaseline()) {
                painter.drawComplexRoundedRect(bar_px, dx, dx, 0, 0, Qt::AbsoluteSize);
                painter.setBrush(bDeco);
                painter.drawEllipse(QPointF(bar_px.center().x(), bar_px.top()+dx), r,r);
            } else {
                painter.drawComplexRoundedRect(bar_px, 0, 0, dx, dx, Qt::AbsoluteSize);
                painter.setBrush(bDeco);
                painter.drawEllipse(QPointF(bar_px.center().x(), bar_px.bottom()-dx), r,r);
            }
        } else {
            // for horizontal barcharts
            const double dx=bar_px.height()/2.0;
            const double r=dx*0.85;
            if (datapoint.x()>=graph->getBaseline()) {
                painter.drawComplexRoundedRect(bar_px, 0, dx, 0, dx, Qt::AbsoluteSize);
                painter.setBrush(bDeco);
                painter.drawEllipse(QPointF(bar_px.right()-dx, bar_px.center().y()), r,r);
            } else {
                painter.drawComplexRoundedRect(bar_px, dx,0,dx,0, Qt::AbsoluteSize);
                painter.setBrush(bDeco);
                painter.drawEllipse(QPointF(bar_px.left()+dx, bar_px.center().y()), r,r);
            }
        }
        painter.restore();
    }
    );
    // enable usage of cutom draw functor
    graph->setUseCustomDrawFunctor(true);
    // set graph color
    graph->setColor(QColor("blue"));
    plot.addGraph(graph);


    // 5. autoscale the plot so the graph is contained
    plot.zoomToFit();

    // 6. show plotter and make it a decent size
    plot.setWindowTitle(title);
    plot.show();
    plot.resize(400,400);
The result looks like this:
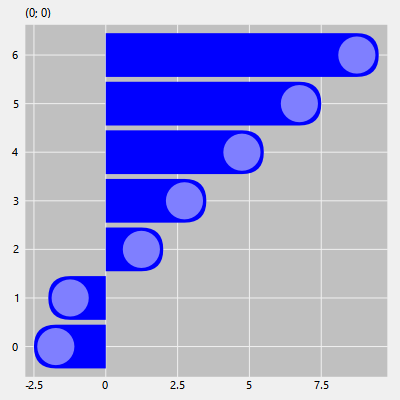
In order to draw horizontal error bars, you have to use JKQTPBarHorizontalGraph instead of JKQTPBarVerticalGraph. The functor given above also covers that case by checking the parameter orientation:

