| .. | ||
| jkqtplotter_simpletest_errorbarstyles_and_lib.pro | ||
| jkqtplotter_simpletest_errorbarstyles.cpp | ||
| jkqtplotter_simpletest_errorbarstyles.pro | ||
| README.md | ||
JKQtPlotter
Different Types of Errorindicators
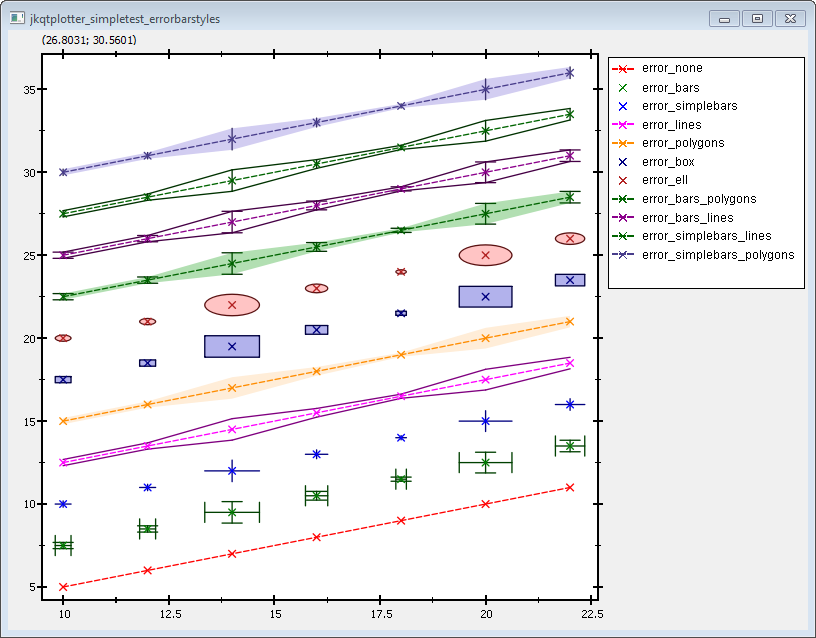
This project (see ./examples/simpletest_errorbarstyles/) simply creates a JKQtPlotter widget (as a new window) and adds several curves show-casing different styles of error indicators. Data is initialized from two QVector objects.
The source code of the main application can be found in jkqtplotter_simpletest_errorbarstyles.cpp.
First some data is added to the internal datastore (mostly, like explained in several other examples, like e.g. Line Graph with Different Symbols and Line Styles). The (in a loop) several graphs are added, each with a distinct style for its error indicators:
    // 3. now we make several plots with different error styles
    //    for that we iterate over every style from the vector errorStyles
    //    the array showXandYError indicates whether we want x- and y-error
    //    for a style for all stywhere this is false, only y-error-indicators
    //    are shown
	QVector<JKQTPerrorPlotstyle> errorStyles    {JKQTPnoError, JKQTPerrorBars, JKQTPerrorSimpleBars, JKQTPerrorLines, JKQTPerrorPolygons, JKQTPerrorBoxes, JKQTPerrorEllipses, JKQTPerrorBarsPolygons, JKQTPerrorBarsLines, JKQTPerrorSimpleBarsLines, JKQTPerrorSimpleBarsPolygons };
    QVector<bool>                showXandYError { false      , true          , true                , false          , false             , true           , true              , false                 , false              , false                    , false                        };

    for (int errorID=0; errorID<errorStyles.size(); errorID++) {
        // generate some plot data
        QVector<double> Y;
        for (auto& xx: X) {
            Y<<xx*0.5+static_cast<double>(errorID)*2.5;
        }

		// create a graph object
        JKQTPxyLineErrorGraph* graph=new JKQTPxyLineErrorGraph(&plot);

        // copy data into datastore and immediately set the yColumn
        graph->set_xColumn(columnX);
        graph->set_yColumn(ds->addCopiedColumn(Y, "y"+QString::number(errorID)));
        graph->set_xErrorColumn(columnXError);
        graph->set_yErrorColumn(columnYError);

        // set error style, for the y-axis
        graph->set_yErrorStyle(errorStyles[errorID]);
        // no error indicators for the x-values
        graph->set_xErrorStyle(JKQTPnoError);
        // ... unless: for some error styles we want error in both directions
        if (showXandYError[errorID]) {
            graph->set_xErrorStyle(errorStyles[errorID]);
            graph->set_drawLine(false);
        }
        // make error indicator 30% transparent
        QColor c=graph->get_errorFillColor();
        c.setAlphaF(0.3);
        graph->set_errorFillColor(c);
        // set error indicator line width
        graph->set_errorWidth(1);
        // set length of small bars at the end of error bars
        graph->set_errorbarSize(15);


        // set symbol (cross/X) + pen style (and color)dashed)
        graph->set_symbol(JKQTPcross);
        graph->set_style(Qt::DashLine);
        // set symbol size
        graph->set_symbolSize(5);
        // set width of symbol lines
        graph->set_symbolWidth(1);
        // set width of graph line
        graph->set_lineWidth(1);

        // graph title is made from symbol+errorStylestyle, we use the LaTeX instruction \verb around the
        // result of JKQTPerrorPlotstyle2String(), because it contains underscores that would otherwise
        // lead to lower-case letter, which we don't want
        graph->set_title("\\verb{"+JKQTPerrorPlotstyle2String(errorStyles[errorID])+"}");

        // add the graph to the plot, so it is actually displayed
        plot.addGraph(graph);
    }
The error styles are set in these lines:
	// set error style, for the y-axis
	graph->set_yErrorStyle(errorStyles[errorID]);
	// no error indicators for the x-values
	graph->set_xErrorStyle(errorStyles[errorID]);
There are several variables that can be used to further style the error indicator, like:
	// make error indicator 30% transparent
	QColor c=graph->get_errorFillColor();
	c.setAlphaF(0.3);
	graph->set_errorFillColor(c);
	// set error indicator line width
	graph->set_errorWidth(1);
	// set length of small bars at the end of error bars
	graph->set_errorbarSize(15);
There are more properties that you can find in the documentation of the mix-in classes JKQTPxyGraphErrors, JKQTPxGraphErrors, JKQTPyGraphErrors, JKQTPgraphErrors.
In addition the plot key is moved outside the pot and the grid in the plot is switched off:
    // 6. change locaion of key (outside top-right)
    plot.get_plotter()->set_keyPosition(JKQTPkeyOutsideRightTop);
    // ... and switch off the grid
    plot.get_xAxis()->set_drawGrid(false);
    plot.get_xAxis()->set_drawMinorGrid(false);
    plot.get_yAxis()->set_drawGrid(false);
    plot.get_yAxis()->set_drawMinorGrid(false);
The result looks like this:
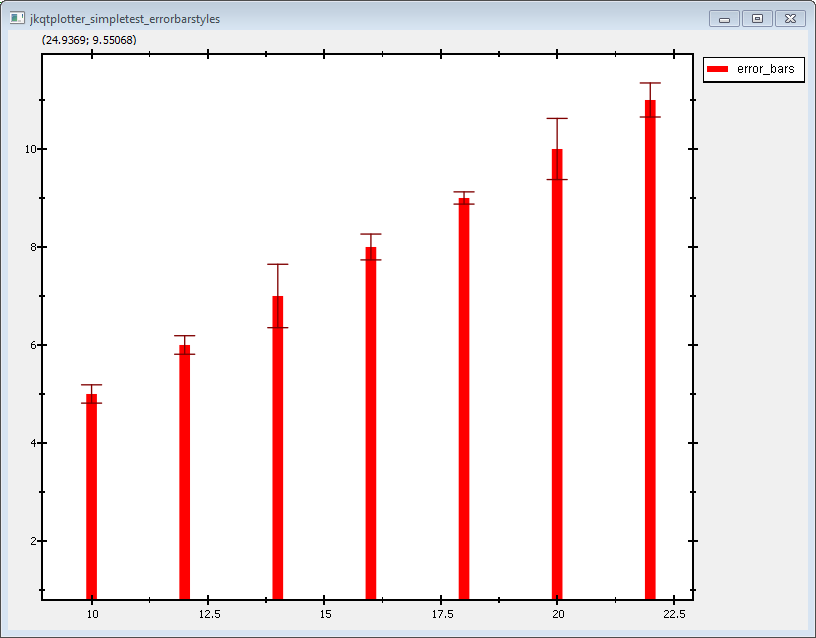
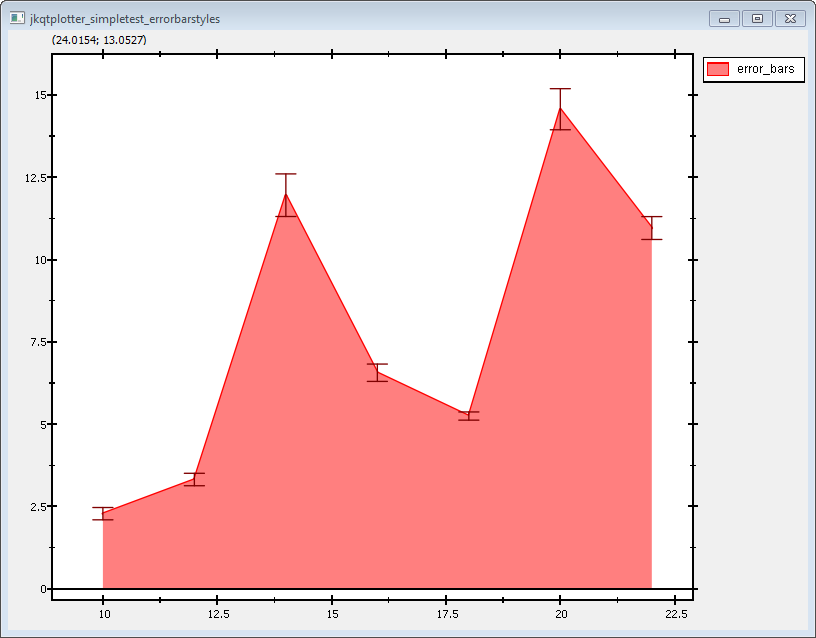
Error bars are implemented in the mixin-classes JKQTPxyGraphErrors, JKQTPxGraphErrors and JKQTPyGraphErrors that are all derived from JKQTPgraphErrors. With these it is simple to add error indicators to several different plot styles. Usually you can recognize these by looking at the class name, e.g. JKQTPxyLineGraph is a simple line+symbol graph, and JKQTPxyLineErrorGraph is the same with error indictaors (see above). There are also several other plots with error indicators:


