mirror of
https://github.com/jkriege2/JKQtPlotter.git
synced 2025-01-27 16:09:15 +08:00
| .. | ||
| CMakeLists.txt | ||
| geo_bezier.cpp | ||
| README.md | ||
Example (JKQTPlotter): Plotting Arrows
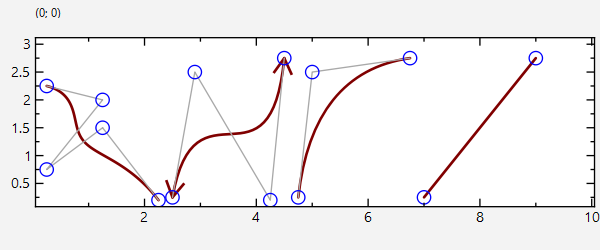
This project shows the capabilities of JKQTPlotter to also draw arrows as geometric elements, using JKQTPGeoBezierCurve.
The source code of the main application can be found in geo_bezier.cpp. First a plot is generated. Then several types of bezier curves are added to the plot and their control points shown.
Here is an example for drawing a cubic bézier curve:
    JKQTPGeoBezierCurve* bezCubic=new JKQTPGeoBezierCurve(&plot);
    bezCubic->setCubic(QPointF(0.25,0.25), QPointF(0.8,2.5), QPointF(3.25,0.2), QPointF(3.75,2.75));
    bezCubic->setLineColor(QColor("maroon"));
    bezCubic->setHeadDecoratorSizeFactor(JKQTPArrow);
    bezCubic->setTailDecoratorSizeFactor(JKQTPArrow);
    plot.addGraph(bezCubic);
Finally we also add symbols for each control point and a poly-line connecting them:
    JKQTPGeoPolyLines* l2;
    plot.addGraph(l2=new JKQTPGeoPolyLines(&plot, bezCubic->getPoints()));
    l2->setLineColor(QColor("darkgrey"));
    l2->setLineWidth(1);
    JKQTPXYScatterGraph* scatCubic=new JKQTPXYScatterGraph(&plot);
    scatCubic->setXYColumns(plot.getDatastore()->addCopiedPoints(bezCubic->getPoints()));
    scatCubic->setSymbolColor(QColor("blue"));
    scatCubic->setSymbolType(JKQTPCircle);
    plot.addGraph(scatCubic);
Here is the resulting plot:
