| .. | ||
| CMakeLists.txt | ||
| financialgraphs.cpp | ||
| README.md | ||
Example (JKQTPlotter): Financial Chart (Candlestick/OHLC) Example
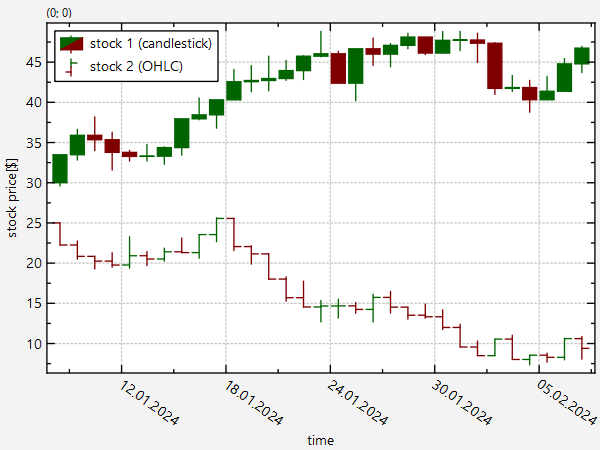
This project (see financialgraphs demonstrates the use of JKQTPFinancialGraph to visualize financial data (i.e. market price development of stocks, derivatives, ...).
The source code of the main application is (see financialgraphs.cpp.
Here is a short summary of the important parts of the code:
First we need to set up the plotter and then generate some data for our plot. Here we use a simple random walk (with normally distributed steps) to simulate the price of some virtual stock. We simulate severals steps ofer NDays days and then calculate the necessary statistics over each day (i.e. the opening and closing price, as well as the daily maximum and minimum). Alternatively you could of course also load actual stock price data and read it in youself.
    // 1. setup a plotter window and get a pointer to the internal datastore (for convenience)
    JKQTPlotter plot;
    JKQTPDatastore* ds=plot.getDatastore();

    // 2. now we create 5 datacolumns with length Ndays entries in the datastore
    //    these will later hold the time-step and simulated market data of two stocks
    const size_t NDays=31;
    const size_t columnT=ds->addColumn("time");
    const size_t columnO1=ds->addColumn("open(stock 1)");
    const size_t columnC1=ds->addColumn("close(stock 1)");
    const size_t columnL1=ds->addColumn("low(stock 1)");
    const size_t columnH1=ds->addColumn("high(stock 1)");
    const size_t columnO2=ds->addColumn("open(stock 2)");
    const size_t columnC2=ds->addColumn("close(stock 2)");
    const size_t columnL2=ds->addColumn("low(stock 2)");
    const size_t columnH2=ds->addColumn("high(stock 2)");
    const QDate t0(2024,1,8); // start date

    // 3. now we simulate stock market data with a simple random walk
    //    with a few steps per day that are summmarized into the four
    //    properties Open,Close,Low,High for each day
    double price1=30; // start price of stock 1
    double price2=25; // start price of stock 2
    const size_t stepsPerDay=20;
    std::random_device rd; // random number generators:
    std::mt19937 gen{rd()};
    gen.seed(12352);
    std::normal_distribution<double> dist1(0.001, 0.6);
    std::normal_distribution<double> dist2(-0.0001, 0.4);
    for (size_t t=0; t<NDays; t+=1) {// iterate over all simulated days (we don't care for weekends)
        // step time from noon to noon in steps of days
        const QDate d=t0.addDays(t);
        ds->appendToColumn(columnT, QDateTime(d,QTime(12,0,0)).toMSecsSinceEpoch());
        // the open-Value is the start-price of each day:
        ds->appendToColumn(columnO1, price1);
        ds->appendToColumn(columnO2, price2);

        // now we iterate the market over the day
        double L1=price1, L2=price2, H1=price1, H2=price2;
        for (size_t i=0; i<stepsPerDay; i++) { // iterate over week days (Mon-Fri)
            // prices are calculated from a sinple random walk (the while-loops ensure that we have positive prices only
            double np;
            while ((np=price1+dist1(gen))<=0.0); price1=np;
            while ((np=price2+dist2(gen))<=0.0); price2=np;
            // now we track the highest/lowest prices
            L1=qMin(L1, price1);
            L2=qMin(L2, price2);
            H1=qMax(H1, price1);
            H2=qMax(H2, price2);
        }
        // the close-Value is the final price of each day:
        ds->appendToColumn(columnC1, price1);
        ds->appendToColumn(columnC2, price2);

        // finally we just have to add the highest and lowest prices of each day:
        ds->appendToColumn(columnL1, L1);
        ds->appendToColumn(columnL2, L2);
        ds->appendToColumn(columnH1, H1);
        ds->appendToColumn(columnH2, H2);
    }
Now we have all columns necessary for two JKQTPFinancialGraph graphs.The first graph will be drawn in the CandleStick style and the second in the OHLC-sytle:
    // 3. create two JKQTPFinancialGraph to display the data:
    JKQTPFinancialGraph* graphCandleStick=new JKQTPFinancialGraph(&plot);
    graphCandleStick->setXColumn(columnT);
    graphCandleStick->setOpenColumn(columnO1);
    graphCandleStick->setHighColumn(columnH1);
    graphCandleStick->setLowColumn(columnL1);
    graphCandleStick->setCloseColumn(columnC1);
    graphCandleStick->setGraphType(JKQTPFinancialGraph::CandleStick);
    graphCandleStick->setTitle(QObject::tr("stock 1 (candlestick)"));
    graphCandleStick->setCandlestickTwoColor(QColor("darkgreen"), QColor("maroon"));

    JKQTPFinancialGraph* graphOHLC=new JKQTPFinancialGraph(&plot);
    graphOHLC->setXColumn(columnT);
    graphOHLC->setOpenColumn(columnO2);
    graphOHLC->setHighColumn(columnH2);
    graphOHLC->setLowColumn(columnL2);
    graphOHLC->setCloseColumn(columnC2);
    graphOHLC->setGraphType(JKQTPFinancialGraph::OHLC);
    graphOHLC->setTitle(QObject::tr("stock 2 (OHLC)"));
    graphOHLC->setOHLCTwoColor(QColor("darkgreen"), QColor("maroon"));

    // 4. add the graphs to the plot, so it is actually displayed
    plot.addGraph(graphCandleStick);
    plot.addGraph(graphOHLC);
Finally we only have to format the plot and coordinate axes slightly to produce a nicer and better readable plot:
// 5. scale the plot so the graph is contained and make x-axis a date-axis
plot.getXAxis()->setTickLabelType(JKQTPCALTdate);
plot.getXAxis()->setAxisLabel("time");
plot.getXAxis()->setTickLabelAngle(35); // rotate axis tick label by 35°, so they are readable
plot.getYAxis()->setAxisLabel("stock price [\\$]");
plot.getMainKey()->setPosition(JKQTPKeyInsideTopLeft);
plot.zoomToFit();```
The result looks like this:
