| .. | ||
| CMakeLists.txt | ||
| example.bmp | ||
| filledgraphs_and_lib.pro | ||
| filledgraphs.cpp | ||
| filledgraphs.pro | ||
| filledgraphs.qrc | ||
| README.md | ||
Example (JKQTPlotter): Filled Curve Plots
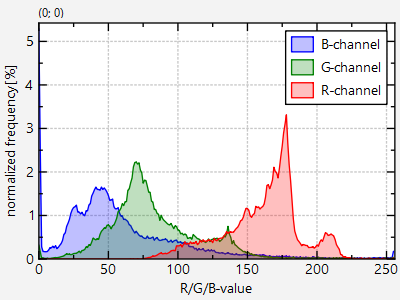
This project (see ./examples/filledgraphs/) simply creates a JKQTPlotter widget (as a new window) and adds several filled curve graphs (Histograms). Data is initialized from QVector objects.
The source code of the main application can be found in filledgraphs.cpp.
First the data columns for three x-y-curves are generated. One column of x-values with entries 0,1,2,...,254,255 (256 entries).
size_t columnX=ds->addLinearColumn(256, 0, 255, "x");
And three columns with 256 entries each, which will be filled with the R-, G- and B-histograms of an image example.bmp:
    size_t columnR=ds->addColumn(256, "historam_R");
    size_t columnG=ds->addColumn(256, "historam_G");
    size_t columnB=ds->addColumn(256, "historam_B");
In order to calculate the histograms, first all enries in the columns are set to 0:
    ds->setAll(columnG, 0);
    ds->setAll(columnR, 0);
    ds->setAll(columnB, 0);
Finally the histogram is calculated:
    QImage image(":/example.bmp");
    for (int y=0; y<image.height(); y++) {
        for (int x=0; x<image.width(); x++) {
            QRgb pix=image.pixel(x,y);
            ds->inc(columnR, qRed(pix), 1);
            ds->inc(columnG, qGreen(pix), 1);
            ds->inc(columnB, qBlue(pix), 1);
        }
    }
    ds->scaleColumnValues(columnR, 100.0/static_cast<double>(image.width()*image.height()));
    ds->scaleColumnValues(columnG, 100.0/static_cast<double>(image.width()*image.height()));
    ds->scaleColumnValues(columnB, 100.0/static_cast<double>(image.width()*image.height()));
Finally three JKQTPFilledCurveXGraph objects are generated and added to the plot (here we show the code for the R-channel only):
    JKQTPFilledCurveXGraph* graphR=new JKQTPFilledCurveXGraph(&plot);

    // set graph titles
    graphR->setTitle("R-channel");

    // set graph colors (lines: non-transparent, fill: semi-transparent
    QColor col;
    col=QColor("red"); graphR->setColor(col);
    col.setAlphaF(0.25); graphR->setFillColor(col);

    // set data
    graphR->setXColumn(columnX); graphR->setYColumn(columnR);


    // add the graphs to the plot, so they are actually displayed
    plot.addGraph(graphR);
The curves are fille with a semi-transparent color, which is achieved by setting col.setAlphaF(0.25) on the graph color col.
The result looks like this:
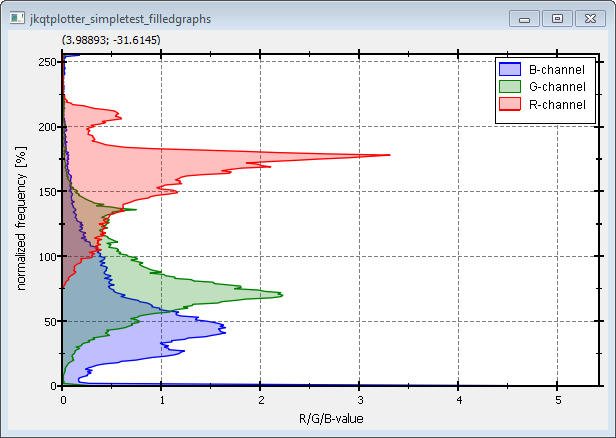
If you use JKQTPFilledCurveYGraph instead of JKQTPFilledCurveXGraph, the curve will not be filled until the y=0-axis, but until the x=0-axis. Of course you will also have to swap the x- and y-data columns. The result will look like this:

