- improved documentation - changed: using static const variables instead of \c #define for fixed default values (e.g. JKQTPImageTools::LUTSIZE, JKQTPImageTools::PALETTE_ICON_WIDTH, JKQTPlotterDrawinTools::ABS_MIN_LINEWIDTH, JKQTMathText::ABS_MIN_LINEWIDTH ...) - new: added debugging option, which surrounds different regions with visible rectangles (JKQTBasePlotter::enableDebugShowRegionBoxes() ) - fixed: colorbars at top were positioned over the plot label - new: frames (plot viewport, key/legend ...) may be rounded off at the corners - new: diverse new styling options (default font name/size ...) - speed improvements to JKQTMathText::useSTIX() |
||
|---|---|---|
| .. | ||
| README.md | ||
| test_user_interaction_and_lib.pro | ||
| test_user_interaction_main.cpp | ||
| test_user_interaction.cpp | ||
| test_user_interaction.h | ||
| test_user_interaction.pro | ||
Tutorial (JKQTPlotter): User-Interactions in JKQtPlotter
Basic Description
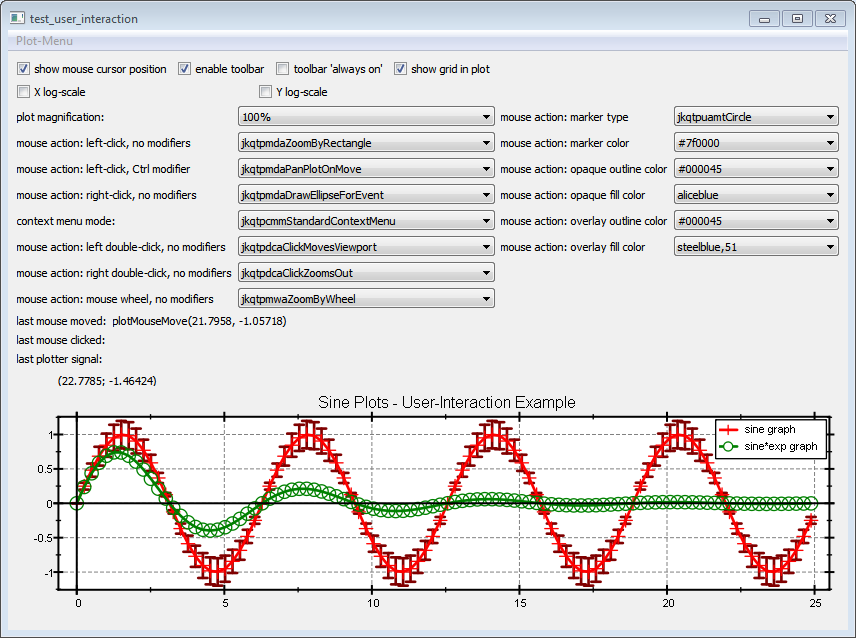
This project (see ./examples/test_user_interaction/) demonstrates different types of user-interactions in JKQTPlotter.
It contains a simple plot with two graphs and provides several widgets that allow to bind different user interactions to different events:
Inner Workings
The source code of the main application can be found in test_user_interaction.cpp.
The menu at the top of the window contains several of the QActions provided for user-interaction by JKQTBasePlotter:
    // add some of the default QActions from the JKQTPlotter to the window menu
    // Some of the are also available in the context menu and toolbar of the JKQTPlotter
    // others are not
    QMenu* menuPlot=menuBar()->addMenu("Plot-Menu");
    menuPlot->addAction(plot->getPlotter()->getActionPrint());
    QMenu* menuPlotS=menuPlot->addMenu("Save ...");
    menuPlotS->addAction(plot->getPlotter()->getActionSaveData());
    menuPlotS->addAction(plot->getPlotter()->getActionSavePDF()); // not available from JKQTPlotter by default
    menuPlotS->addAction(plot->getPlotter()->getActionSavePlot());
    QMenu* menuPlotZ=menuPlot->addMenu("Zoom ...");
    menuPlotZ->addAction(plot->getPlotter()->getActionZoomAll());
    menuPlotZ->addAction(plot->getPlotter()->getActionZoomIn());
    menuPlotZ->addAction(plot->getPlotter()->getActionZoomOut());
The rest of the form contains several Qt widgets which switch diverse aspects of the plot style (log-axes, grid on/off ...) and allow to bind different actions to several defined events, e.g.
    // add a QComboBox that allows to set the left mouse button action for the JKQTPlotter
    cmbLeftNoModMouseAction=new QComboBox(this);
    layForm->addRow("mouse action: left-click, no modifiers", cmbLeftNoModMouseAction);
    cmbLeftNoModMouseAction->addItem("jkqtpmdaPanPlotOnMove");
    cmbLeftNoModMouseAction->addItem("jkqtpmdaPanPlotOnRelease");
    cmbLeftNoModMouseAction->addItem("jkqtpmdaZoomByRectangle");
    cmbLeftNoModMouseAction->addItem("jkqtpmdaDrawRectangleForEvent");
    cmbLeftNoModMouseAction->addItem("jkqtpmdaDrawCircleForEvent");
    cmbLeftNoModMouseAction->addItem("jkqtpmdaDrawEllipseForEvent");
    cmbLeftNoModMouseAction->addItem("jkqtpmdaDrawLineForEvent");
    cmbLeftNoModMouseAction->addItem("jkqtpmdaScribbleForEvents");
    cmbLeftNoModMouseAction->addItem("NoMouseAction");
    cmbLeftNoModMouseAction->setCurrentIndex(2);
    connect(cmbLeftNoModMouseAction, SIGNAL(currentIndexChanged(int)), this, SLOT(setLeftMouseAction(int)));
    setLeftMouseAction(cmbLeftNoModMouseAction->currentIndex());

    // ......

    void TestUserInteraction::setLeftMouseAction(int index)
    {
        if (index==cmbLeftNoModMouseAction->count()-1) plot->deregisterMouseDragAction(Qt::LeftButton, Qt::NoModifier);
        else plot->registerMouseDragAction(Qt::LeftButton, Qt::NoModifier, static_cast<JKQTPMouseDragActions>(index));
    }
As you can see, this QComboBox registers one of the available actions to the event of a left-button single mouse click without having modifiers pressed at the same time. The slot that actually reconfigures the JKQTPlotter uses the methods JKQTPlotter::deregisterMouseDragAction() and JKQTPlotter::registerMouseDragAction() to achieve this effect.
Available User-Interactions
You can play around with this example to find out about different types of user interactions. SOm of them are illustrated with animations below.
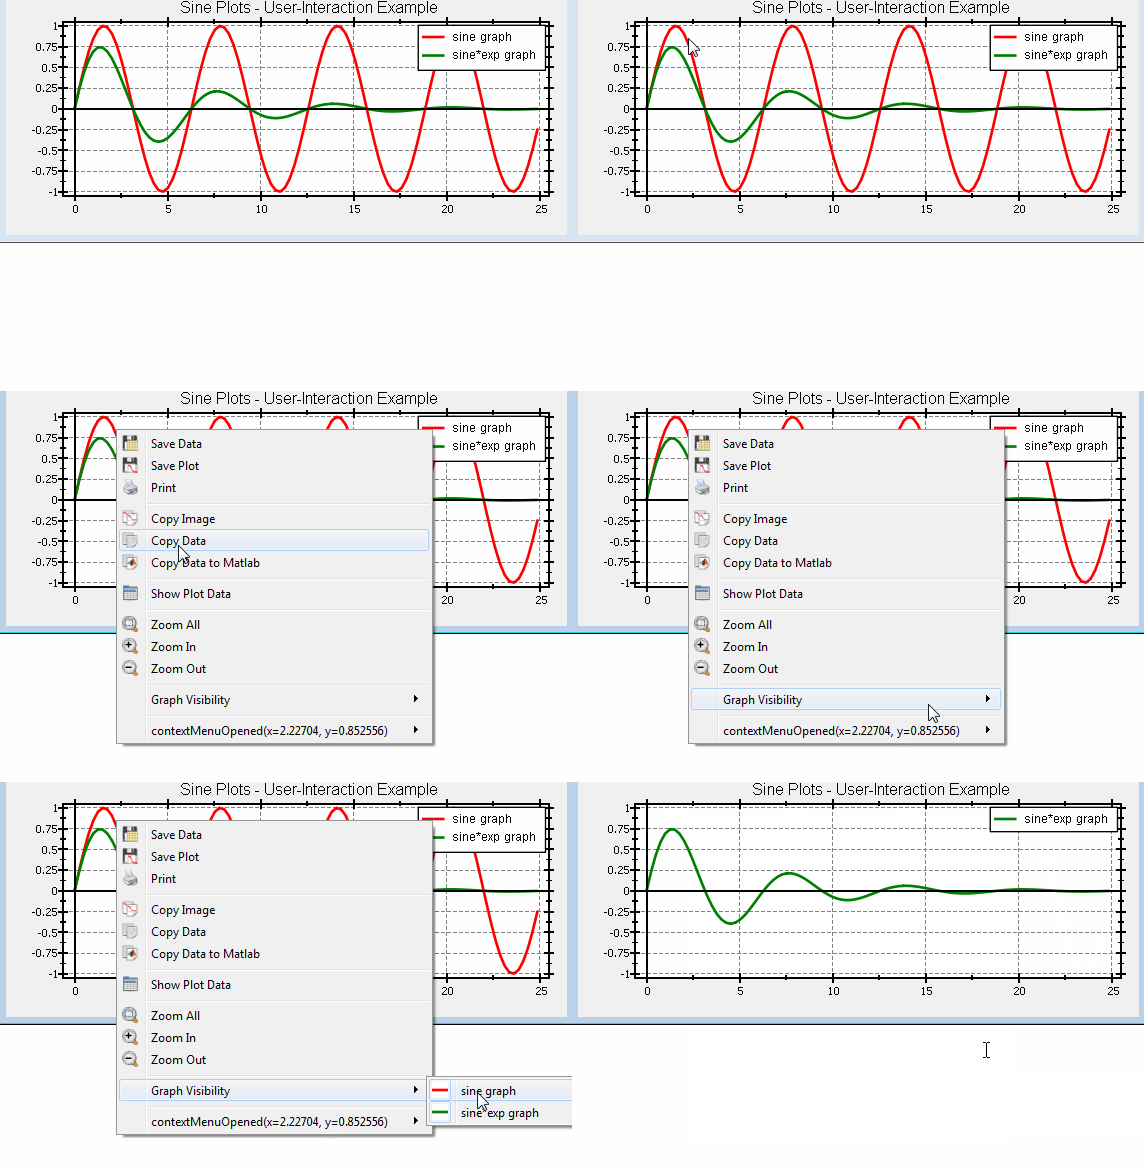
Switching Graph Visibility via Context Menu
the default context menu contains a sub-menu that allows to switch every graph and and off:
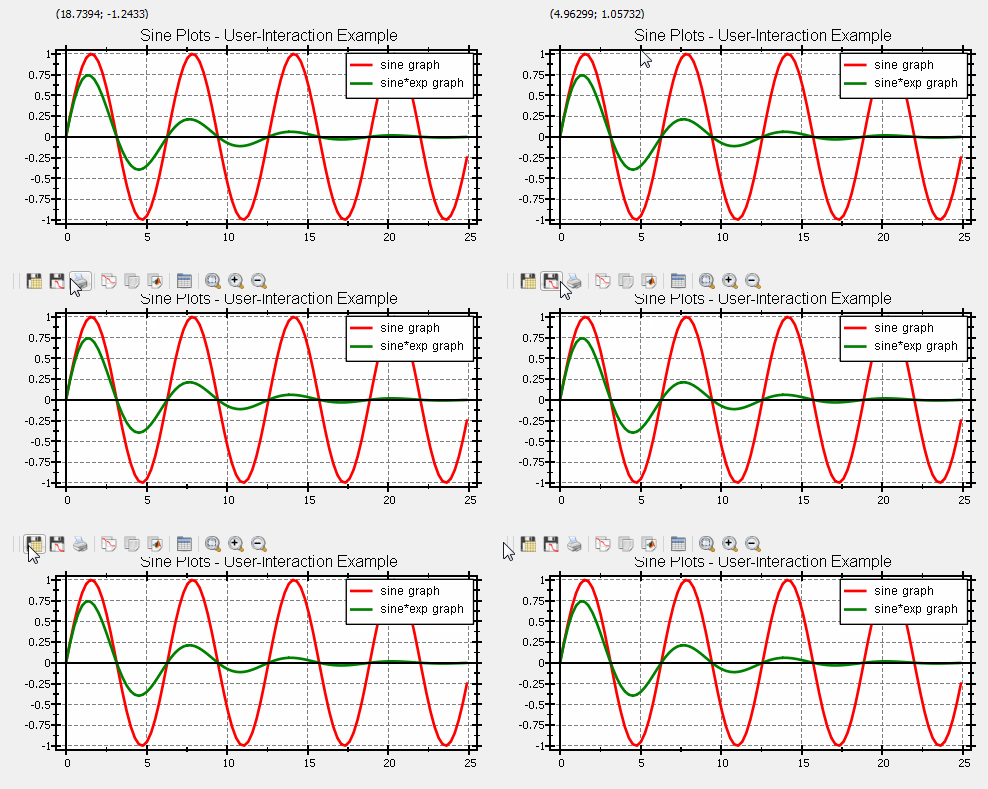
Toolbar at the top of the Plot
Each JKQTPlotter contains a toolbar that is by default invisible and appears, when the mouse moves over a designated area at the top of the plot:
You can also use the checkboxes "enable toolbar" to disable this toolbar alltogether and "toolbar 'always on'" to switch the vanishing feature off and make it visible all the time.
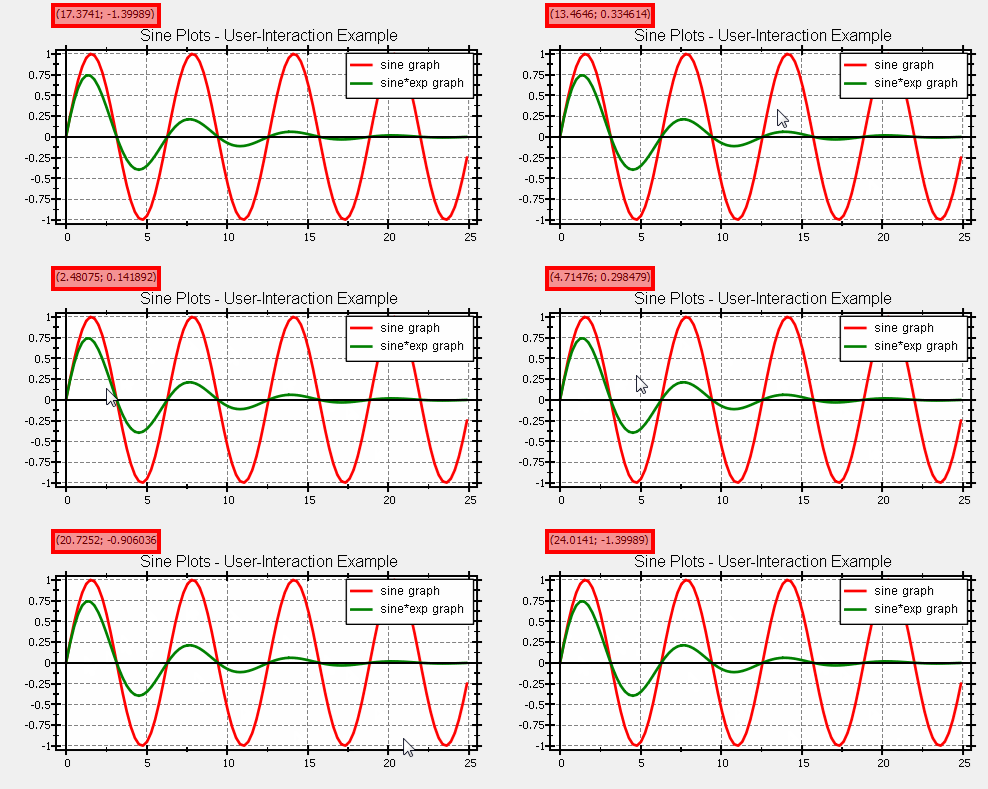
Mouse Position Display
The JKQTPlotter contains a small text display for the current mouse position (in plot coordinates) at the top of the graph:
Drag the Plot Viewport
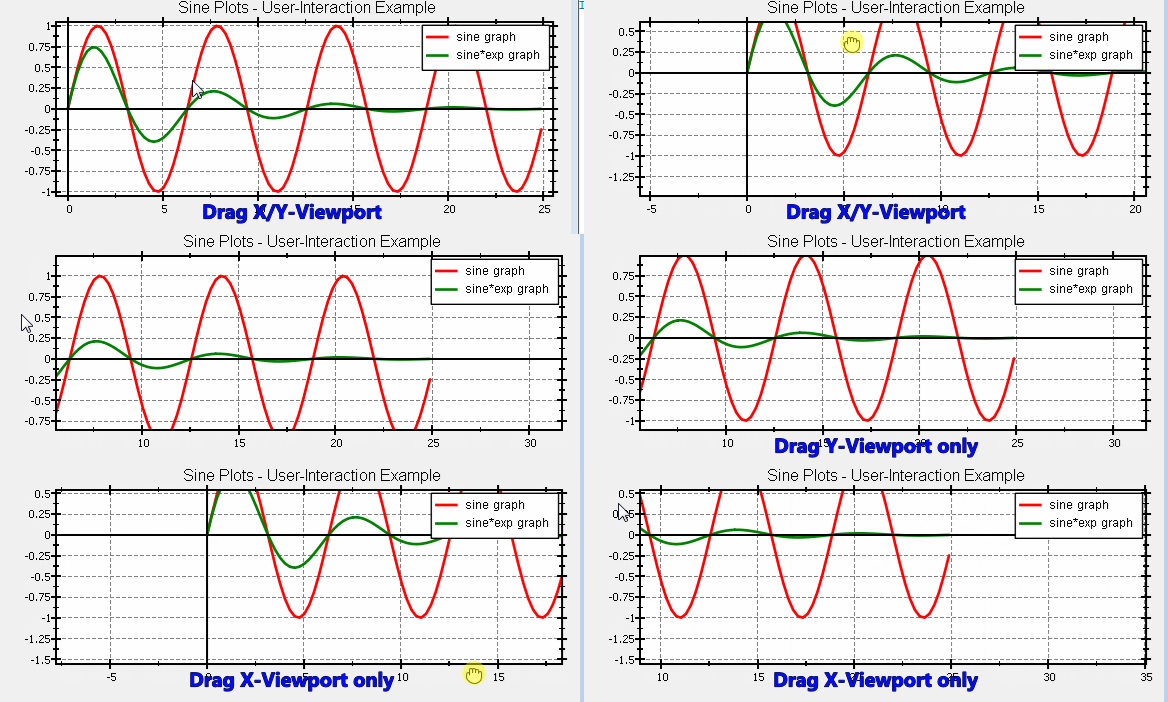
You can move the viewport of the graph using the mouse ("jkqtpmdaPanPlotOnMove"-action). If you drag inside the plot window, you can move in both directions, if you drag over one of the coordinate axes, you can change the range of this axis only:
Zooming with the Mouse
There are several options to zoom, using the mouse:
- using the mouse wheel
- with double-click actions jkqtpdcaClickZoomsOut, jkqtpdcaClickZoomsIn
- using the context menu (or the toolbar)
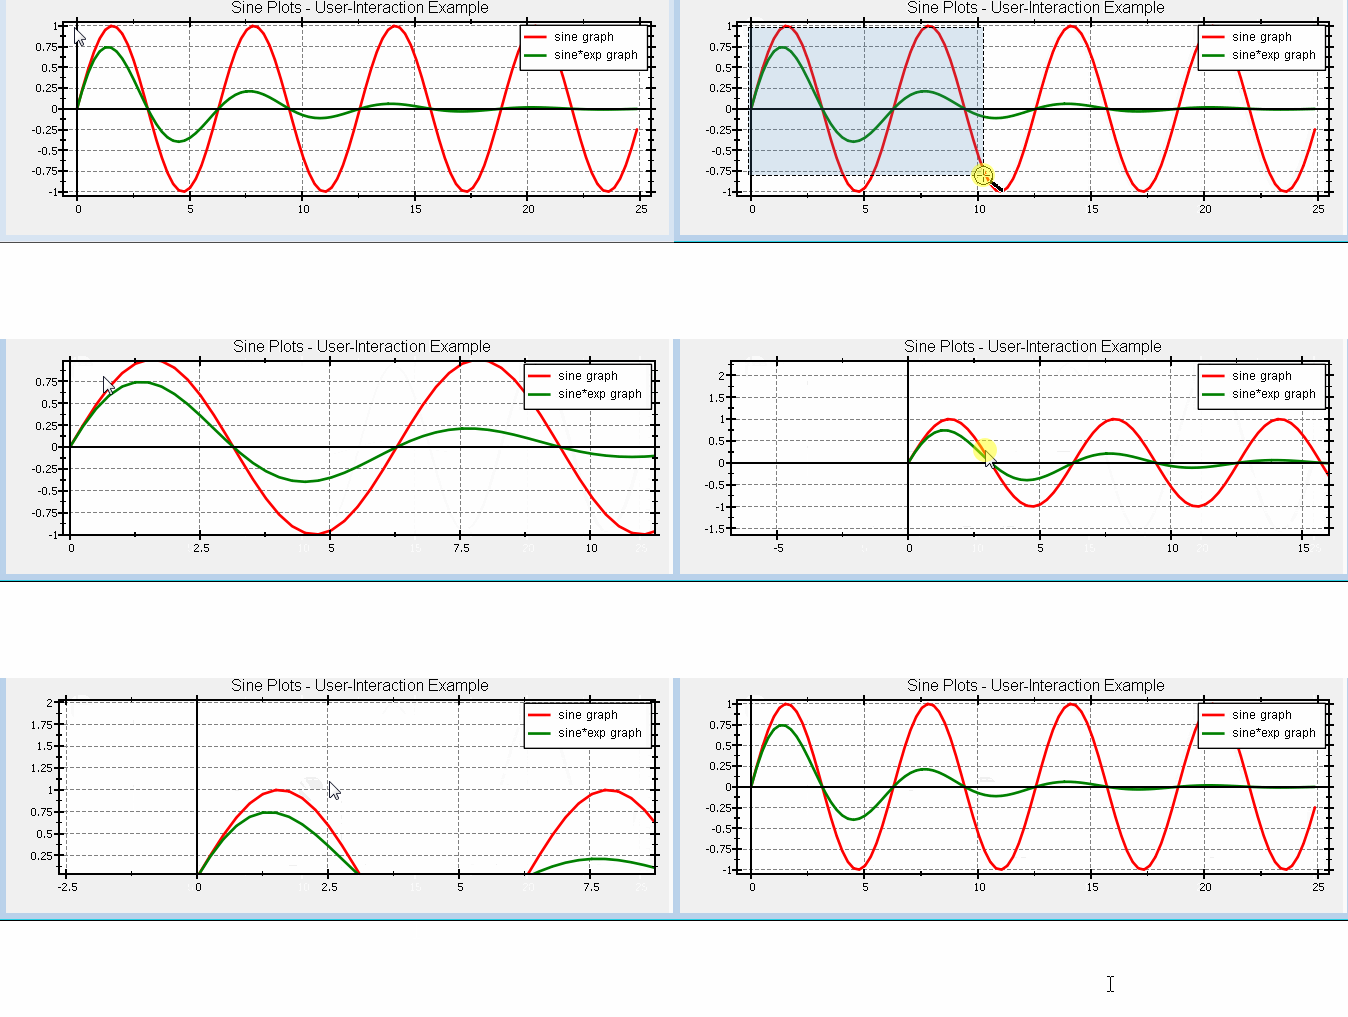
Again these actions are limited to a single axis, if the mouse is above that axis (and not inside the actual plot rectangle).
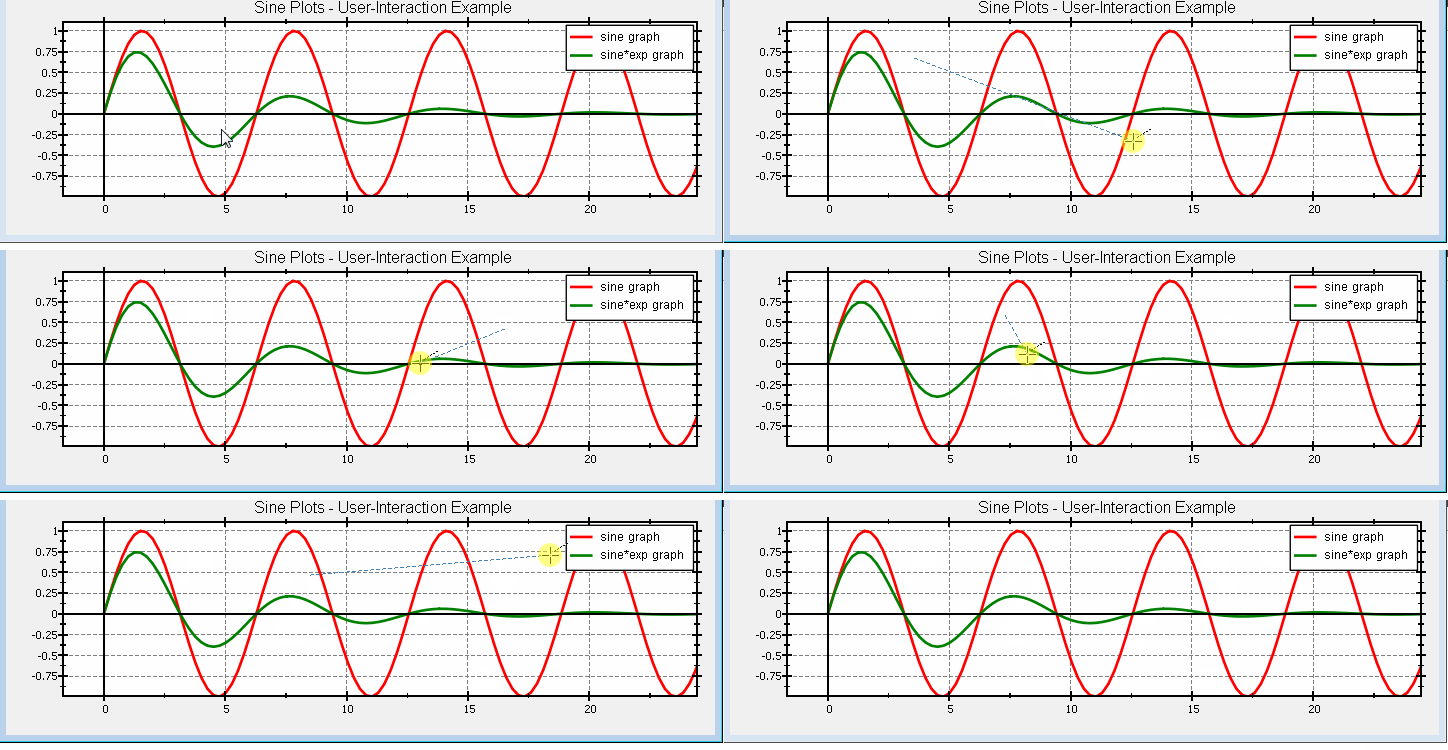
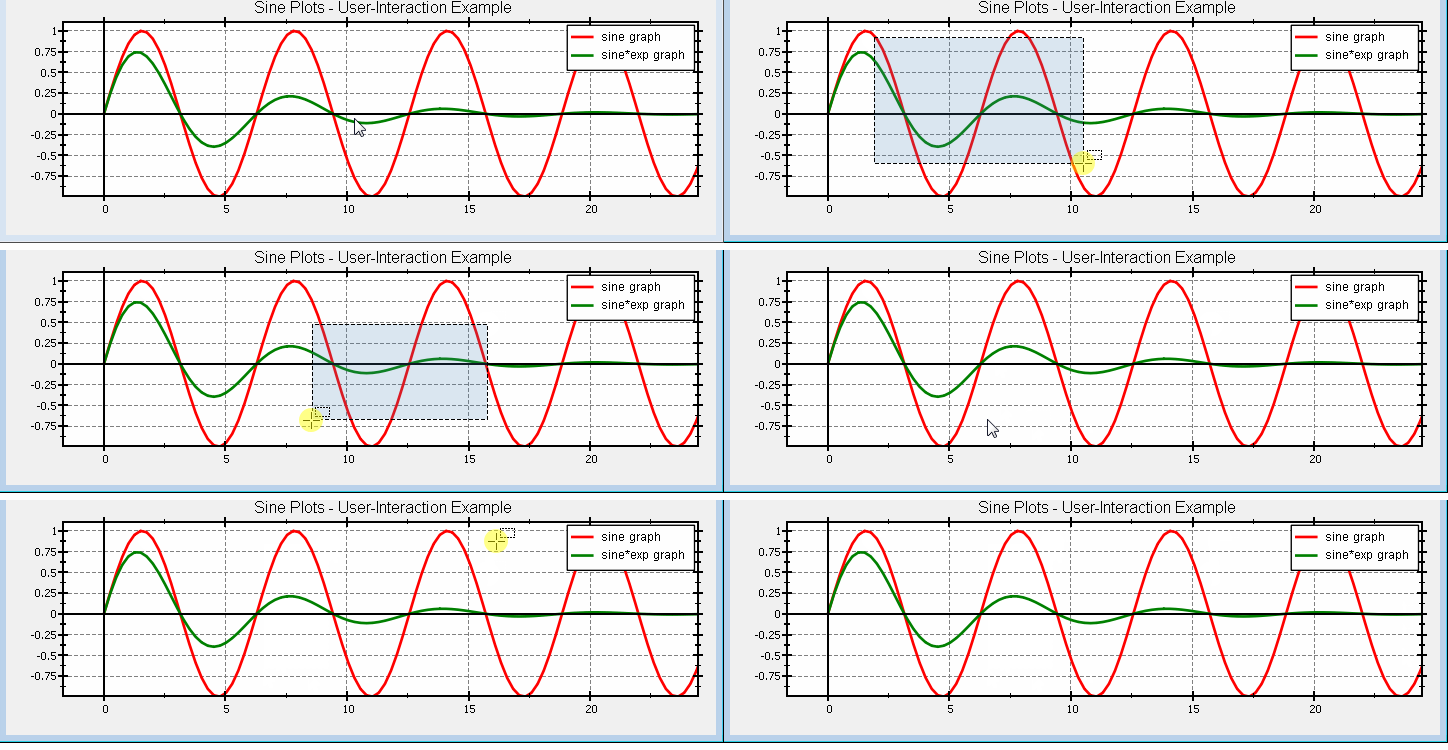
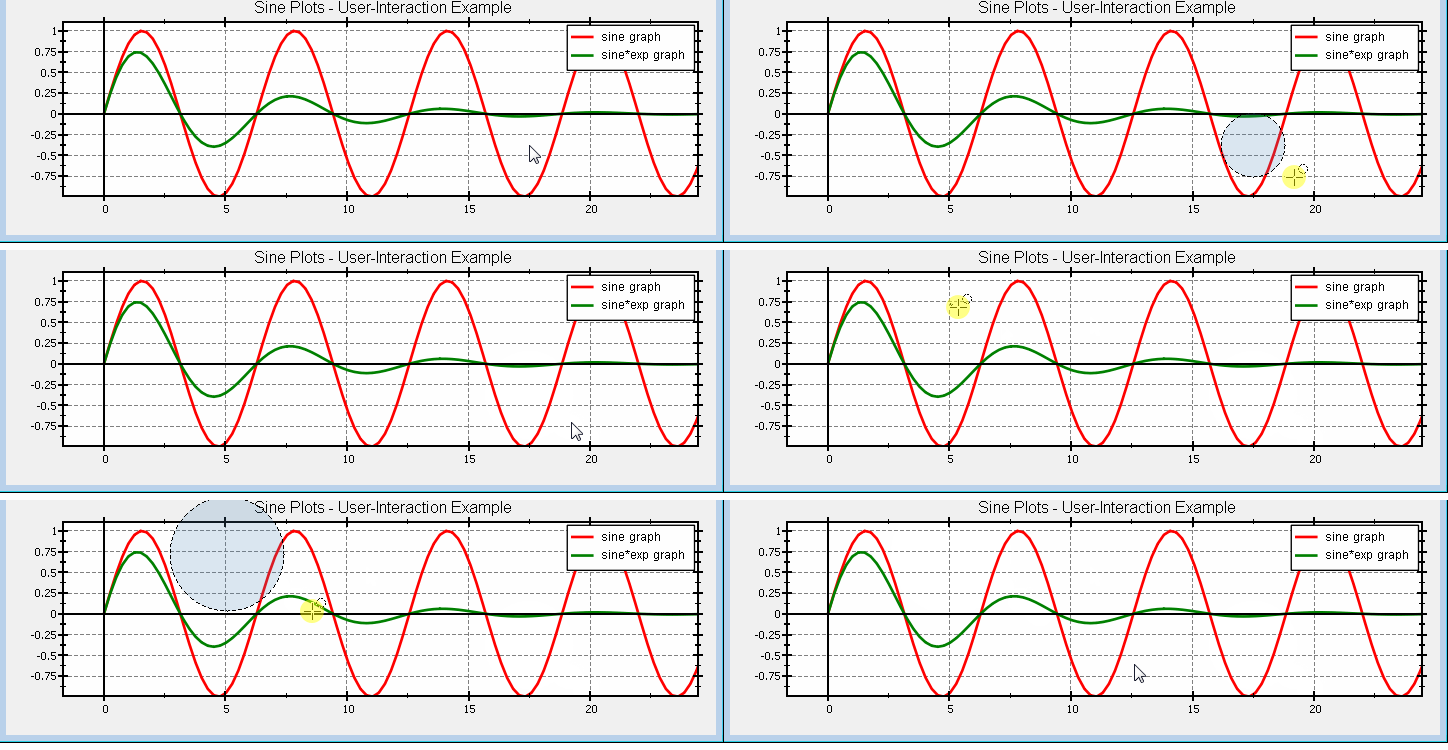
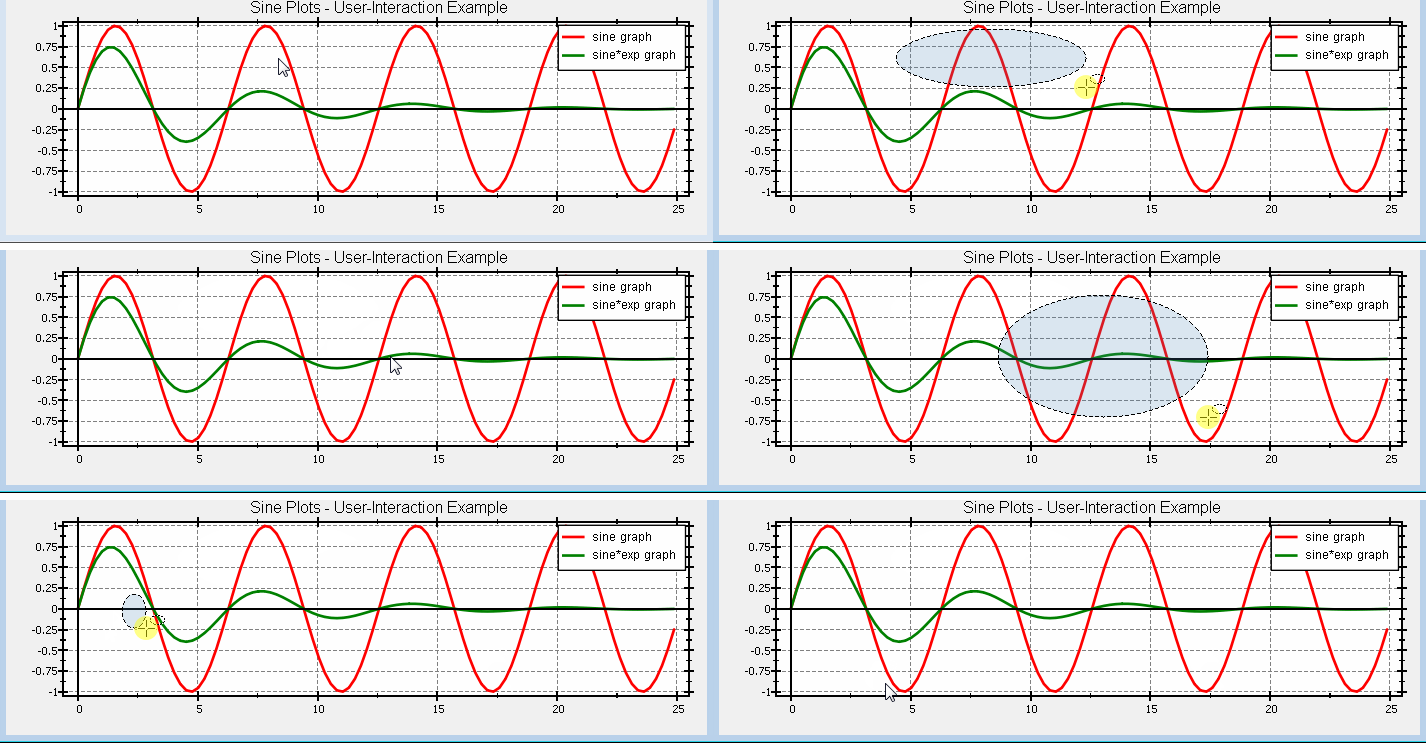
Drawing Geometrical Forms
You can also use the mouse to draw various geometricals forms. When you finish drawing, a single event is emitted for that form, which contains its size and position:
