mirror of
https://github.com/jkriege2/JKQtPlotter.git
synced 2025-02-22 20:22:13 +08:00
| .. | ||
| CMakeLists.txt | ||
| graphlabels.cpp | ||
| README.md | ||
Example (JKQTPlotter): Simple Graph Labels Example
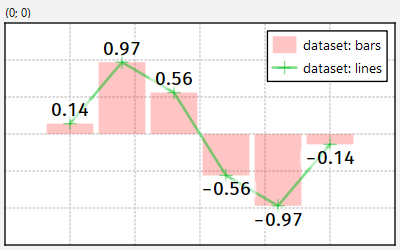
This project (see graphlabels demonstrates the use of JKQTPXYGraphLabels to add labels to the datapoints of a graph.
The source code of the main application is (see graphlabels.cpp.
Here is a short summary of the important parts of the code:
    // 1. create a plotter window and get a pointer to the internal datastore (for convenience)
    JKQTPlotter plot;
    JKQTPDatastore* ds=plot.getDatastore();


    // 2. make up some arbitrary data to be used for plotting
    const size_t columnX=ds->addLinearColumn(Ndata, -1,1,"x");
    const size_t columnY=ds->addCalculatedColumnFromColumn(columnX, [](double x) { return jkqtp_roundToDigits(-sin(x*3.0),2);}, "data");


    // 3. create barchart and line-chart to display the data:
    // 3.1 Barcart:
    JKQTPBarVerticalGraph* graph1=new JKQTPBarVerticalGraph(&plot);
    graph1->setBarPositionColumn(columnX);
    graph1->setBarHeightColumn(columnY);
    graph1->setTitle(QObject::tr("dataset: bars"));
    graph1->setColor(QColorWithAlphaF(graph1->getFillColor(),0.25));
    // 3.2: LineChart:
    JKQTPXYLineGraph* graph2=new JKQTPXYLineGraph(&plot);
    graph2->setXColumn(columnX);
    graph2->setYColumn(columnY);
    graph2->setTitle(QObject::tr("dataset: lines"));
    graph2->setColor(QColorWithAlphaF(graph2->getLineColor(),0.5));

    // 4. now we add the data labels:
    // 4.1. create a JKQTPXYGraphLabels instance that displays the y-values at each location:
    JKQTPXYGraphLabels* graphLabels=new JKQTPXYGraphLabels(JKQTPXYGraphLabels::YValueLabel, &plot);
    // use the same (x,y) dataset as above. This is used on the one hand to derive the position of the label and on the other hand the label contents
    graphLabels->setXColumn(graph1->getXColumn());
    graphLabels->setYColumn(graph1->getYColumn());

    // 4.2. set position of labels and some styling options
    graphLabels->setLabelPosition(JKQTPGLabelAwayFromXAxis);
    graphLabels->setTextFontSize(14);

    // 5. add the graphs to the plot, so it is actually displayed
    plot.addGraph(graph1);
    plot.addGraph(graph2);
    plot.addGraph(graphLabels);
The result looks like this:
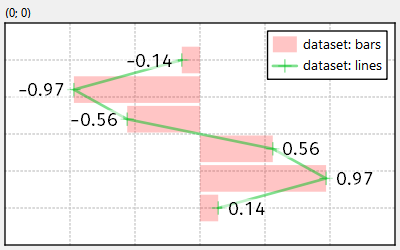
or this:

