mirror of
https://github.com/jkriege2/JKQtPlotter.git
synced 2024-12-26 18:41:40 +08:00
NEW/BREAKING: refactor CMake-Code, so static/dynamic switch is done via <code>BUILD_SHARED_LIBS</code>, which retires <code>JKQtPlotter_BUILD_STATIC_LIBS</code>, <code>JKQtPlotter_BUILD_SHARED_LIBS</code> and removes the capability to build static and shared libraries in one location (fixes issue #104) NEW: prepareed library for CMake's <a href="https://cmake.org/cmake/help/latest/module/FetchContent.html">FetchContent</a>-API NEW: the different sub-libraries JKQTPlotter, JKQTFastPlotter (DEPRECATED), JKQTMath, JKQTMathText can be activated/deactivated with CMake options JKQtPlotter_BUILD_LIB_JKQTPLOTTER, JKQtPlotter_BUILD_LIB_JKQTFASTPLOTTER, JKQtPlotter_BUILD_LIB_JKQTMATHTEXT, JKQtPlotter_BUILD_LIB_JKQTMATH |
||
|---|---|---|
| .. | ||
| CMakeLists.txt | ||
| example.bmp | ||
| README.md | ||
| rgbimageplot_qt_and_lib.pro | ||
| rgbimageplot_qt.cpp | ||
| rgbimageplot_qt.pro | ||
| rgbimageplot_qt.qrc | ||
Example (JKQTPlotter): QImage as a Graph
This project (see ./examples/rgbimageplot_qt/) simply creates a JKQTPlotter widget (as a new window) and adds an image plot with an image taken from a QImage object.
The source code of the main application is (see rgbimageplot_qt.cpp. the main parts are:
    // 2. now we open a BMP-file and load it into an OpenCV cv::Mat
    QImage image(":/example.bmp");

    // 3. create a graph (JKQTPImage) with a pointer to the QImage-object, generated above
    JKQTPImage* graph=new JKQTPImage(&plot);
    graph->setTitle("");
    // copy the image into the graph (optionally you could also give a pointer to a QImage,
    // but then you need to ensure that the QImage is available as long as the JKQTPImage
    // instace lives)
    graph->setImage(image);
    // where does the image start in the plot, given in plot-axis-coordinates (bottom-left corner)
    graph->setX(0);
    graph->setY(0);
    // width/height of the image in plot coordinates
    graph->setWidth(image.width());
    graph->setHeight(image.height());

    // 4. add the graphs to the plot, so it is actually displayed
    plot.addGraph(graph);
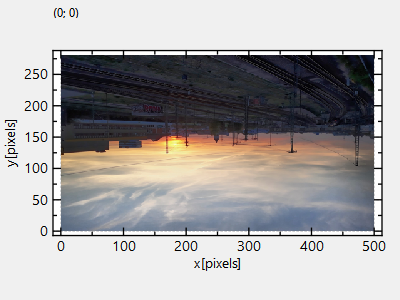
The result looks like this:
The image is upside-down, because computer images use a coordinate system with 0 at the top-left (left-handed coordinate system) and the JKQTPlotter has its 0 at the bottom-left (right-handed coordinate system).
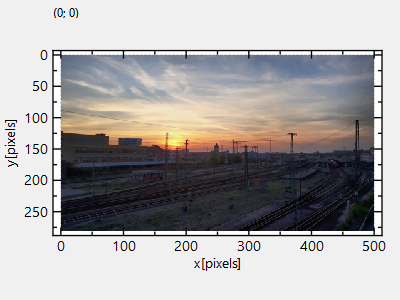
You can modify the program above to display the image in the correct orientation, by adding the line
    // 6.1 invert y-axis, so image is oriented correctly
    plot.getYAxis()->setInverted(true);
This will reorient the y-axis to point from top to bottom (for increasing positive coordinates):

