mirror of
https://github.com/jkriege2/JKQtPlotter.git
synced 2025-02-24 17:31:47 +08:00
| .. | ||
| barchart_twocolor.cpp | ||
| CMakeLists.txt | ||
| README.md | ||
Example (JKQTPlotter): Barchart With Two-Color Fill-Mode
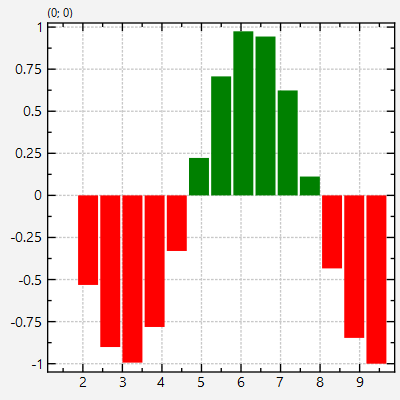
This project (see barchart_twocolor shows how to draw barcharts, where the bars are filled differently if their value is above or below the baseline.
The source code of the main application is (see barchart_twocolor.cpp:
    // 1. create a plotter window and get a pointer to the internal datastore (for convenience)
    JKQTPlotter plot;
    JKQTPDatastore* ds=plot.getDatastore();

    // 2. now we create two columns for key and value
    size_t columnK=ds->addLinearColumn(10, 0, 2.0*JKQTPSTATISTICS_PI,"k");
    size_t columnV=ds->addColumnCalculatedFromColumn(columnK, &cos, "v");

    // 3. create graph in the plot, which plots the dataset:
    JKQTPBarGraphBase* graph=new JKQTPBarVerticalGraph(&plot);
    graph->setKeyColumn(columnK);
    graph->setValueColumn(columnV);
    // set TwoColor fill Mode
    graph->setFillMode(JKQTPBarGraphBase::FillMode::TwoColorFilling);
    graph->setFillColor(QColor("green"));
    graph->fillStyleBelow().setFillColor(QColor("red"));
    plot.addGraph(graph);

    // 4 autoscale the plot so the graph is contained
    plot.zoomToFit();

    // 5. show plotter and make it a decent size
    plot.setWindowTitle(title);
    plot.show();
    plot.resize(400,400);
The result looks like this:
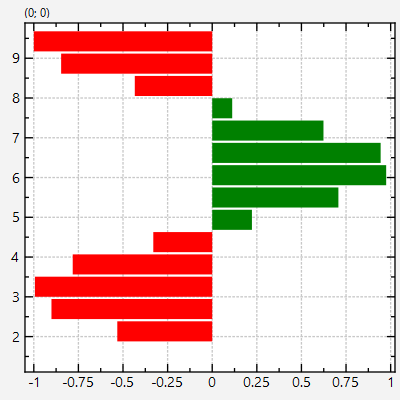
In order to draw horizontal error bars, you have to use JKQTPBarHorizontalGraph instead of JKQTPBarVerticalGraph:

