JKQtPlotter/examples/graphlabels
2024-02-06 14:49:14 +01:00
..
CMakeLists.txt NEW: JKQTPXYGraphLabels which can draw a label next to each datapoint in the given x/y-dataset. The labels can be x-/y- or x&y-coordinates or custom, then defined by a user-supplied functor (+example \ref JKQTPlotterGraphLabels) 2024-02-06 14:49:14 +01:00
graphlabels.cpp NEW: JKQTPXYGraphLabels which can draw a label next to each datapoint in the given x/y-dataset. The labels can be x-/y- or x&y-coordinates or custom, then defined by a user-supplied functor (+example \ref JKQTPlotterGraphLabels) 2024-02-06 14:49:14 +01:00
README.md NEW: JKQTPXYGraphLabels which can draw a label next to each datapoint in the given x/y-dataset. The labels can be x-/y- or x&y-coordinates or custom, then defined by a user-supplied functor (+example \ref JKQTPlotterGraphLabels) 2024-02-06 14:49:14 +01:00

Example (JKQTPlotter): Simple Graph Labels Example

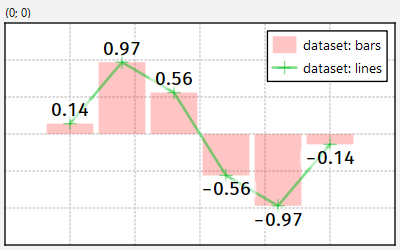
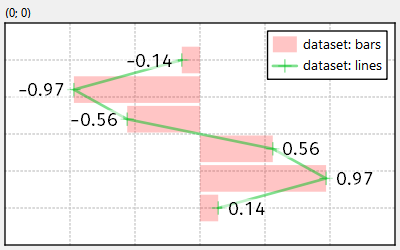
This project (see graphlabels demonstrates the use of JKQTPXYGraphLabels to add labels to the datapoints of a graph.

The source code of the main application is (see graphlabels.cpp:

The result looks like this:

graphlabels

or this:

graphlabels_hor