NEW/BREAKING: refactor CMake-Code, so static/dynamic switch is done via <code>BUILD_SHARED_LIBS</code>, which retires <code>JKQtPlotter_BUILD_STATIC_LIBS</code>, <code>JKQtPlotter_BUILD_SHARED_LIBS</code> and removes the capability to build static and shared libraries in one location (fixes issue #104) NEW: prepareed library for CMake's <a href="https://cmake.org/cmake/help/latest/module/FetchContent.html">FetchContent</a>-API NEW: the different sub-libraries JKQTPlotter, JKQTFastPlotter (DEPRECATED), JKQTMath, JKQTMathText can be activated/deactivated with CMake options JKQtPlotter_BUILD_LIB_JKQTPLOTTER, JKQtPlotter_BUILD_LIB_JKQTFASTPLOTTER, JKQtPlotter_BUILD_LIB_JKQTMATHTEXT, JKQtPlotter_BUILD_LIB_JKQTMATH |
||
|---|---|---|
| .. | ||
| CMakeLists.txt | ||
| README.md | ||
| test_distributionplot_and_lib.pro | ||
| test_distributionplot.cpp | ||
| test_distributionplot.pro | ||
Example (JKQTPlotter): Plotting a Statistical Distribution of Data
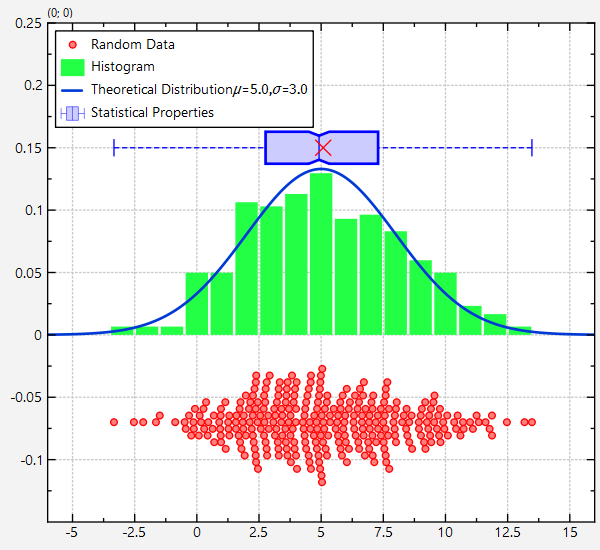
This project (see test_distributionplot demonstrates how to combine several different graphs and geometric elements to show a set of random values and their statistics.
[JKQTPlotterBasicJKQTPDatastore]: @ref JKQTPlotterBasicJKQTPDatastore "Basic Usage of JKQTPDatastore" [JKQTPlotterBasicJKQTPDatastoreIterators]: @ref JKQTPlotterBasicJKQTPDatastoreIterators "Iterator-Based usage of JKQTPDatastore" [JKQTPlotterBasicJKQTPDatastoreStatistics]: @ref JKQTPlotterBasicJKQTPDatastoreStatistics "Advanced 1-Dimensional Statistics with JKQTPDatastore" [JKQTPlotterBasicJKQTPDatastoreRegression]: @ref JKQTPlotterBasicJKQTPDatastoreRegression "Regression Analysis (with the Statistics Library)" [JKQTPlotterBasicJKQTPDatastoreStatistics2D]: @ref JKQTPlotterBasicJKQTPDatastoreStatistics2D "Advanced 2-Dimensional Statistics with JKQTPDatastore" [statisticslibrary]: @ref jkqtptools_math_statistics "JKQTPlotter Statistics Library" [JKQTPlotterBoxplotStyling]: @ref JKQTPlotterBoxplotStyling "Styling different aspects of boxplots" [JKQTPlotterBoxplotsGraphs]: @ref JKQTPlotterBoxplotsGraphs "Boxplots"
Note that this example explains how to generate the statistics plots by hand, i.e. by calculating all the statistical properties for the boxplots and then adding the necessary graphs. The internal [statisticslibrary] offers methods to perform these calculations, which are explained in the tutorial [JKQTPlotterBasicJKQTPDatastoreStatistics] in detail. Several examples give more details on boxplots: [JKQTPlotterBoxplotsGraphs], [JKQTPlotterBoxplotStyling].
The source code of the main application is (see test_distributionplot.cpp.
After adding all necessary data to the JKQTDatastore:
    // 1. create a plotter window and get a pointer to the internal datastore (for convenience)
    JKQTPlotter plot;
    plot.getPlotter()->setUseAntiAliasingForGraphs(true); // nicer (but slower) plotting
    plot.getPlotter()->setUseAntiAliasingForSystem(true); // nicer (but slower) plotting
    plot.getPlotter()->setUseAntiAliasingForText(true); // nicer (but slower) text rendering
    JKQTPDatastore* ds=plot.getDatastore();

    // 2. now we create random values drawn from a gaussian distribution
    QVector<double> RANDVAL; // will store the values themselves
    std::map<int, double> hist; // is used to calculate the histogram of the data
    for (int i=-5; i<=15; i++) hist[i]=0;

    std::random_device rd; // random number generators:
    std::mt19937 gen{rd()};

    // draw 301 random values from a gaussian distribution around 5 with width 3
    const double th_mean=5;
    const double th_std=3;
    std::normal_distribution<> d{th_mean,th_std};
    size_t NDATA=301;
    double sum=0;
    double square_sum=0;
    for (size_t i=0; i<NDATA; i++) {
        const double v=d(gen);
        RANDVAL<<v; // store data
        ++hist[std::round(v)]; // calculate histogram
        // accumulate data for statistics:
        sum+=v;
        square_sum+=(v*v);
    }
    // normalize histogram
    for (auto& hi: hist) {
        hi.second=hi.second/static_cast<double>(NDATA);
    }
    // sort random data in order to calculate the statistical properties:
    qSort(RANDVAL);
    const double rndMean=sum/static_cast<double>(NDATA);
    const double rndMin=RANDVAL.first();
    const double rndMax=RANDVAL.last();
    const double rndMedian=RANDVAL[RANDVAL.size()/2];
    const double rndQ25=RANDVAL[RANDVAL.size()/4];
    const double rndQ75=RANDVAL[RANDVAL.size()*3/4];
    const double rndMedianConfidence=2.0*1.57*fabs(rndQ75-rndQ25)/sqrt(static_cast<double>(NDATA));

    // 3. make data available to JKQTPlotter by adding it to the internal datastore.
    size_t columnRANDVAL=ds->addCopiedColumn(RANDVAL, "RANDVAL"); // copy random values
    std::pair<size_t,size_t> columnHIST = ds->addCopiedMap(hist, "HIST_X", "HIST_Y"); // copy histogram


    // 4. create a graph of horizontal boxplots:
    JKQTPSingleColumnSymbolsGraph* graphRANDVALS=new JKQTPSingleColumnSymbolsGraph(&plot);
    graphRANDVALS->setDataColumn(columnRANDVAL);
    // draw data as symbols at (x,y)=(data,-0.07):
    graphRANDVALS->setDataDirection(JKQTPSingleColumnSymbolsGraph::DataDirection::X);
    graphRANDVALS->setPosition(-0.07);
    // data should scatter around position=-0.07 with a width=0.08 (i.e. from position-width/2 ... position+width/2)
    //graphRANDVALS->setWidth(0.08);
    //graphRANDVALS->setPositionScatterStyle(JKQTPSingleColumnSymbolsGraph::RandomScatter);
    // data should scatter around position=-0.07 in a BeeSwarmScatter-Plot
    graphRANDVALS->setPositionScatterStyle(JKQTPSingleColumnSymbolsGraph::BeeSwarmScatter);
    // choose small filled circles as symbols, JKQTPGraphSymbols::set their color:
    graphRANDVALS->setSymbolType(JKQTPFilledCircle);
    graphRANDVALS->setSymbolSize(5);
    graphRANDVALS->setColor(QColor("red"));
    graphRANDVALS->setFillColor(graphRANDVALS->getColor().lighter(180));
    // set title:
    graphRANDVALS->setTitle("Random Data");


    // 5. draw the histogram as barchart:
    JKQTPBarVerticalGraph* graphHIST=new JKQTPBarVerticalGraph(&plot);
    graphHIST->setXColumn(columnHIST.first);
    graphHIST->setYColumn(columnHIST.second);
    // set title:
    graphHIST->setTitle("Histogram");


    // 6. draw the theoretical distribution as function graph:
    JKQTPXFunctionLineGraph* graphTheoDist=new JKQTPXFunctionLineGraph(&plot);
    // define the gaussian function used for the random number generator
    graphTheoDist->setPlotFunctionFunctor([&th_mean,&th_std](double x) -> double {
        return 1.0/(th_std*sqrt(2.0*M_PI))*exp(-0.5*(x-th_mean)*(x-th_mean)/th_std/th_std);
    });
    // set title:
    graphTheoDist->setTitle(QString("Theoretical Distribution $\\mu=%1, \\sigma=%2$").arg(th_mean,0, 'f', 1).arg(th_std,0, 'f', 1));


    // 7. create a graph of horizontal boxplots:
    JKQTPBoxplotHorizontalElement* graphBoxPlot=new JKQTPBoxplotHorizontalElement(&plot);
    graphBoxPlot->setPos(0.15);
    graphBoxPlot->setMin(rndMin);
    graphBoxPlot->setPercentile25(rndQ25);
    graphBoxPlot->setMean(rndMean);
    graphBoxPlot->setMedian(rndMedian);
    graphBoxPlot->setMedianConfidenceIntervalWidth(rndMedianConfidence);
    graphBoxPlot->setPercentile75(rndQ75);
    graphBoxPlot->setMax(rndMax);
    graphBoxPlot->setBoxWidthAbsolute(24);
    graphBoxPlot->setMeanSize(16);
    graphBoxPlot->setLineWidth(2);
    graphBoxPlot->setTitle("Statistical Properties");
    graphBoxPlot->setBoxplotColor(QColor("blue"), plot.getPlotter());
    // make fill collor a lighter shade of the outline color
    graphBoxPlot->setFillColor(graphBoxPlot->getLineColor().lighter(180));
    // make whiskers dashed
    graphBoxPlot->setWhiskerLineStyle(Qt::DashLine);


    // 8. add the graphs to the plot, so it is actually displayed
    plot.addGraph(graphRANDVALS);
    plot.addGraph(graphHIST);
    plot.addGraph(graphTheoDist);
    plot.addGraph(graphBoxPlot);


    // 9. autoscale the plot so the graph is contained
    plot.zoomToFit();

    // 10. Move key to top-left
    plot.getPlotter()->setKeyPosition(JKQTPKeyInsideTopLeft);

    // 11. show plotter and make it a decent size
    plot.show();
    plot.resize(800,800);
The result looks like this:
