[Back to JKQTPlotter main page](../README.md)
# JKQtPlotter
## Examples & Tutorials
This section assembles some simple examples of usage.
You can find more (complex) examples for the classes in this repository in the subfolder "test".
All test-projects are Qt-projects that use qmake to build. You can load them into QtCreator easily.
### Different Plot Data Styles
| Screenshot | Description | Notes |
|:-------------:| ------------- | ------------- |
| [](./simpletest) | [Very Basic Example (Line Graph)](./simpletest) | `JKQTPxyLineGraph`
C++-style QVector arrays of data |
| [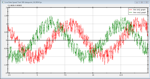](./simpletest_speed) | [Line Graph with Live Data / Speed Test](./simpletest_speed) | `JKQTPxyLineGraph`
external `std::array` data, not owned by datastore
live-data, measure plotting speed
tipps to increas plotting speed |
| [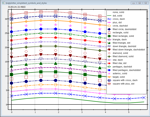](./simpletest_symbols_and_styles) | [Line Graph with Different Symbols and Line Styles](./simpletest_symbols_and_styles) | `JKQTPxyLineGraph`
C++ vector of data
setting line styles and symbol styles
automatic graph coloring |
| [](./simpletest_stepplots) | [Step Line Plots in Different Styles](./simpletest_stepplots) | `JKQTPstepHorizontalGraph` (and `JKQTPxyLineGraph`)
C++ vector of data
different step modes, filled and line-only |
| [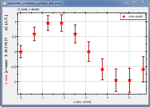](./simpletest_symbols_and_errors) | [Simple Line/Symbol Graph With Errorbars](./simpletest_symbols_and_errors) | `JKQTPxyLineErrorGraph`
C-style arrays of data |
| [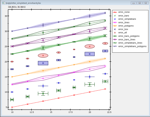](./simpletest_errorbarstyles) | [Different Types of Error Indicators](./simpletest_errorbarstyles) | `JKQTPxyLineErrorGraph`
different styles of error indicators for x- and y-errors
C++-style QVector for data
styling error indicators
moving key and formatting plotter grid |
| [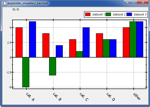](./simpletest_barchart) | [Simple Bar Charts](./simpletest_barchart) | `JKQTPbarVerticalGraph`
C-style arrays of data |
| [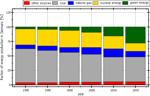
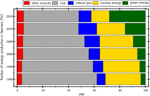](./simpletest_stackedbars) | [Stacked Bar Charts](./simpletest_stackedbars) | `JKQTPbarVerticalStackableGraph`, `JKQTPbarHorizontalStackableGraph`
C++-style vectors of data |
| [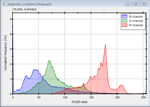](./simpletest_filledgraphs) | [Filled Curve Plots](./simpletest_filledgraphs) | `JKQTPbarVerticalGraph`
setting/altering data in `JKQTPdatstore` directly
transparent plots
calculating histograms |
| [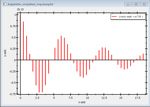](./simpletest_impulsesplot) | [Impulse Plots](./simpletest_impulsesplot) | `JKQTPimpulsesVerticalGraph` and `JKQTPimpulsesHorizontalGraph`
C++-style QVector as plot data |
| [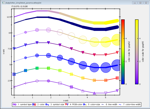](./simpletest_paramscatterplot) | [Scatter Graph with Parametrized Symbols/Colors](./simpletest_paramscatterplot) | `JKQTPxyParametrizedScatterGraph`
C++-style QVector as plot data
modify scatter/points/line-graph properties by data |
| [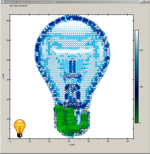](./simpletest_paramscatterplot_image) | [Draw an Artistic Image with a Parametrized Scatter Graph](./simpletest_paramscatterplot_image) | `JKQTPxyParametrizedScatterGraph`
C++-style QVector as plot data
rectangular arrangement of scatters
generative computer graphics |
| [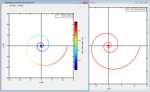](./simpletest_parametriccurve) | [Plotting Parametric Curves](./simpletest_parametriccurve) | `JKQTPxyLineGraph` and `JKQTPxyParametrizedScatterGraph`
C++-style QVector as plot data
parametric curve plotting |
| [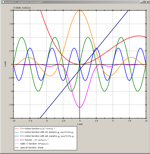](./simpletest_functionplot) | [Plotting Mathematical Functions as Line Graphs](./simpletest_functionplot) | `JKQTPxFunctionLineGraph`
diretly plotting C/C++-functions |
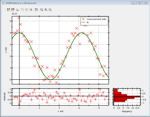
| [](./simpletest_parsedfunctionplot) | [Plotting Parsed Mathematical Functions as Line Graphs](./simpletest_parsedfunctionplot) | `JKQTPxParsedFunctionLineGraph`
plotting functions with the internal math equation parser/evaluator |
| [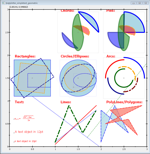](./simpletest_geometric) | [Plotting Geometric Objects](./simpletest_geometric) | |
### Styling the Plot, Keys, Axes, ...
| Screenshot | Description | Notes |
|:-------------:| ------------- | ------------- |
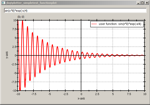
| [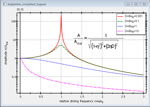](./simpletest_logaxes) | [logarithmic axes](./simpletest_logaxes) | `JKQTPxyLineGraph` and `JKQTPgeoText`
C++ vector of data
logarithmic axes and styling
plot line styles
internal LaTeX parser
add commenting text to a graph |
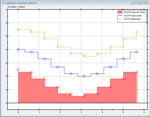
| [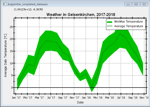
](./simpletest_dateaxes) | [date/time axes](./simpletest_dateaxes) | `JKQTPxyLineGraph` and `JKQTPfilledVerticalRangeGraph`
C++ vector of data
date/time axes
plot min/max range graph
internal LaTeX parser
data from CSV files |
### Image data Plots
| Screenshot | Description | Notes |
|:-------------:| ------------- | ------------- |
| [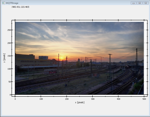](./simpletest_rgbimageplot_qt) | [`QImage` as a Graph](./simpletest_rgbimageplot_qt) | `JKQTPImage`
`QImage` drawn onto a plot with arbitrary scaling) |
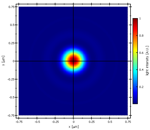
| [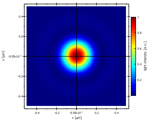](./simpletest_imageplot) | [Basic 1-channel Raw C Image Plot](./simpletest_imageplot) | `JKQTPColumnMathImage`
image data copied from C-style row-major array into a single column of the internal datastore
Describes several options of the image plotting classes (different ways of color coding, what to do with data above/below the limits etc.) |
| [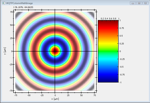](./simpletest_imageplot_modifier) | [Modifier-Feature of Image Plots](./simpletest_imageplot_modifier) | `JKQTPColumnMathImage`
image data copied from C-style row-major array into a single column of the internal datastore
Image is modified by a second image to display two data dimensions at the same time |
| [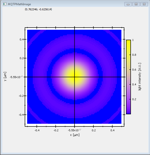](./simpletest_imageplot_nodatastore) | [Basic 1-channel Raw C Image Plot
without the internal datastore](./simpletest_imageplot_nodatastore) | `JKQTPMathImage`
image data in a C-style row-major array, not using internal datastore |
| [](./simpletest_imageplot_opencv) | [1-channel OpenCV cv::Mat Image Plot](./simpletest_imageplot_opencv) | `JKQTPColumnMathImage`
image data copied from OpenCV cv::Mat-structure into a single column of the internal datastore |
| [](./simpletest_rgbimageplot_opencv) | [RGB OpenCV cv::Mat Image Plot](./simpletest_rgbimageplot_opencv) | `JKQTPColumnRGBMathImage`
image data copied from OpenCV cv::Mat-structure into three columns of the internal datastore |
### GUI Tools and Plot Layout
| Screenshot | Description | Notes |
|:-------------:| ------------- | ------------- |
| [](./test_multiplot) | [Layouting Several Plots](./test_multiplot) | Combining plots in Qt Layouts
linking plot axes
copy data from a `std::map` int the datastore
print plots/print preview |
| [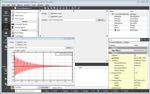](./simpletest_ui) | [Placing JKQtPlotter into a Qt User-Interface-XML-file (`*.ui`)](./simpletest_ui) | using Qt Form Designer
parsed function plots (`JKQTPxParsedFunctionLineGraph`) |
### Tools and Special Features
| Screenshot | Description | Notes |
|:-------------:| ------------- | ------------- |
| [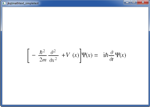](./jkqtmathtext_simpletest) | [JKQTMathText: LaTeX Renderer](./jkqtmathtext_simpletest) | |
[Back to JKQTPlotter main page](../README.md)