# Example (JKQTPlotter): Simple math image plot, showing a 3-channel CImg image {#JKQTPlotterImagePlotRGBCImg}
This project (see `./examples/rgbimageplot_cimg/`) simply creates a JKQTPlotter widget (as a new window) and shows an RGB image read from a BMP-file. The image is generated as an [cimg](https://cimg.org/) [`cimg_library::CImg<uint8_t>`](http://cimg.eu/reference/structcimg__library_1_1CImg.html) image and then copied into a single column of the internal datastore (JKQTPMathImage could be directly used without the internal datastore).
To copy the data a special cimg Interface function `JKQTPCopyCImgToColumn()` is used, that copies the data from a [CImg](https://cimg.eu/) [`cimg_library::CImg<uint8_t>`](http://cimg.eu/reference/structcimg__library_1_1CImg.html) directly into a column.
The function `JKQTPCopyCImgToColumn()` is available from the (non-default) header-only extension from `jkqtplotter/jkqtpinterfacecimg.h`. This header provides facilities to interface JKQTPlotter with cimg. The cimg-binding itself is header-only, and NOT compiled into the JKQtPlotter libraries. Therefore you can simply include the header and use the facilities provided by it.
The CMake-build system of JKQtPlotter (and its examples) provides facilities to allow for `find_package(CImg)` to compile against that library.
If you want to build the CImg-based JKQtPlotter examples (see list above), you either have to ensure that CMake finds CImg by itself (i.e. somewhere in the default search paths, e.g. `CMAKE_INSTALL_PREFIX`), or you can set the CMake variable `CImg_DIR` so it points to the directory of the `CImg.h` file, or before configuring JKQtPlotter.
The source code of the main application is (see [`rgbimageplot_cimg.cpp`](https://github.com/jkriege2/JKQtPlotter/tree/master/examples/rgbimageplot_cimg/rgbimageplot_cimg.cpp):
```.cpp
#include <QApplication>
#include <cmath>
#include "jkqtplotter/jkqtplotter.h"
#include "jkqtplotter/graphs/jkqtpscatter.h"
#include "jkqtplotter/graphs/jkqtpimagergb.h"
#include "jkqtplotter/jkqtpinterfacecimg.h"
#include "CImg.h"
int main(int argc, char* argv[])
{
QApplication app(argc, argv);
JKQTPlotter plot;
// 1. create a plotter window and get a pointer to the internal datastore (for convenience)
plot.getPlotter()->setUseAntiAliasingForGraphs(true); // nicer (but slower) plotting
plot.getPlotter()->setUseAntiAliasingForSystem(true); // nicer (but slower) plotting
plot.getPlotter()->setUseAntiAliasingForText(true); // nicer (but slower) text rendering
JKQTPDatastore* ds=plot.getDatastore();
// 2. now we open a BMP-file and load it into an cimg cv::Mat
cimg_library::CImg<uint8_t> picture; // CImg<T>-Image for the data
picture.load_bmp("rgbimageplot_cimg_example.bmp");
qDebug()<<picture.width()<<"x"<<picture.height()<<"x"<<picture.spectrum();
// 3. make data available to JKQTPlotter by adding it to the internal datastore.
// In this step the contents of each channel of the cimg cv::Mat is copied into a column
// of the datastore in row-major order
size_t cPictureR=JKQTPCopyCImgToColumn(ds, picture, "R-channel", 0);
size_t cPictureG=JKQTPCopyCImgToColumn(ds, picture, "G-channel", 1);
size_t cPictureB=JKQTPCopyCImgToColumn(ds, picture, "B-channel", 2);
// 4. create a graph (JKQTPColumnRGBMathImage) with the columns created above as data
JKQTPColumnRGBMathImage* graph=new JKQTPColumnRGBMathImage(&plot);
graph->setTitle("");
// where does the image start in the plot, given in plot-axis-coordinates (bottom-left corner)
graph->setX(0);
graph->setY(0);
// width and height of the image in plot-axis-coordinates
graph->setWidth(picture.width());
graph->setHeight(picture.height());
// image column with the data
graph->setImageRColumn(static_cast<int>(cPictureR));
graph->setImageGColumn(static_cast<int>(cPictureG));
graph->setImageBColumn(static_cast<int>(cPictureB));
// determine min/max of each channel manually
graph->setImageMinR(0);
graph->setImageMaxR(255);
graph->setImageMinG(0);
graph->setImageMaxG(255);
graph->setImageMinB(0);
graph->setImageMaxB(255);
// 5. add the graphs to the plot, so it is actually displayed
plot.addGraph(graph);
// 6. set axis labels
plot.getXAxis()->setAxisLabel("x [pixels]");
plot.getYAxis()->setAxisLabel("y [pixels]");
// 6.1 invert y-axis, so image is oriented correctly
plot.getYAxis()->setInverted(true);
// 7. fix axis aspect ratio to width/height, so pixels are square
plot.getPlotter()->setMaintainAspectRatio(true);
plot.getPlotter()->setAspectRatio(double(picture.width())/double(picture.height()));
// 8. autoscale the plot so the graph is contained
plot.zoomToFit();
// show plotter and make it a decent size
plot.show();
plot.resize(800,600);
plot.setWindowTitle("JKQTPColumnRGBMathImage");
return app.exec();
}
```
The result looks like this:
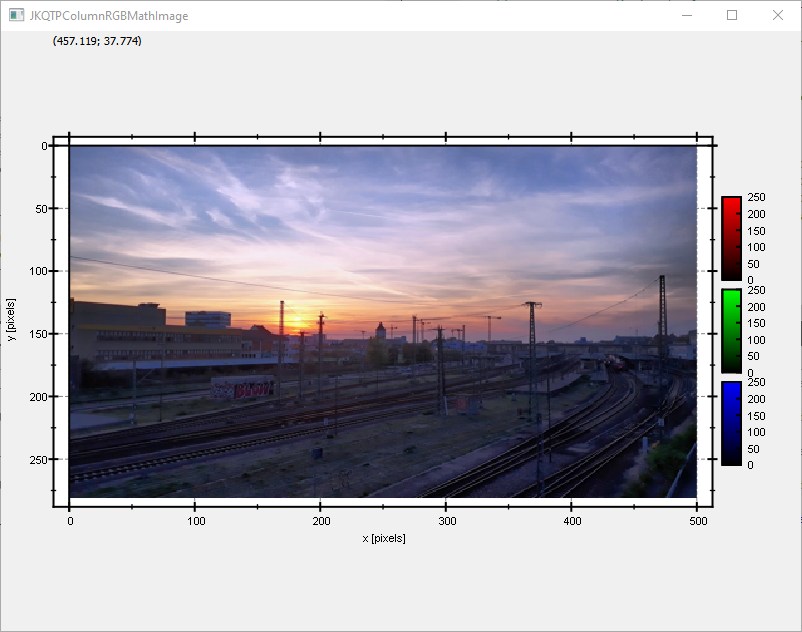
Note the step
```.cpp
// 5.1 invert y-axis, so image is oriented correctly
plot.getYAxis()->setInverted(true);
```
above, which ensures that the image is not draw upside-down! This will reorient the y-axis to point from top to bottom (for increasing positive coordinates).
The image would be upside-down, because computer images use a coordinate system with 0 at the top-left (left-handed coordinate system) and the JKQTPlotter has its 0 at the bottom-left (right-handed coordinate system).
See [`examples/rgbimageplot`](https://github.com/jkriege2/JKQtPlotter/tree/master/examples/rgbimageplot) for a detailed description of the other possibilities that the class JKQTPColumnRGBMathImage offer with respect to determining how an image is plotted.