# Tutorial (JKQTPlotter): Styling a JKQtPlotter {#JKQTPlotterStyling}
[TOC]
# Basic Description
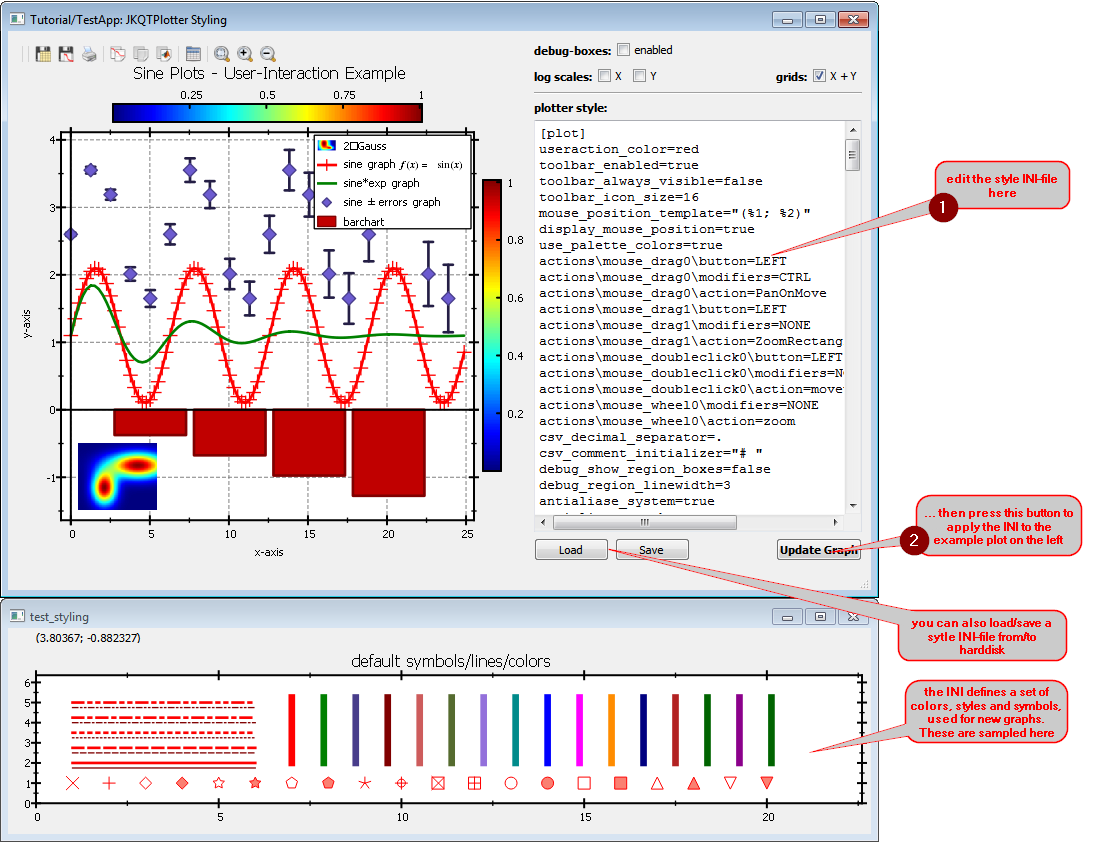
This project (see `./examples/test_styling/`) demonstrates different types of user-interactions in JKQTPlotter.
It contains a simple plot with two graphs and provides several widgets that allow to modify the plot styling by editing an INI file:
# Altering the Default Style
## Global/System-wide Settings
The `main()`-function can be found in [`test_styling_main.cpp`](https://github.com/jkriege2/JKQtPlotter/tree/master/examples/test_styling/test_styling_main.cpp). Here the Qt application is initialized in the usual way and the main window `win` is created and shown. After instanciating the `QApplication`, but befor instanciating the window (and thus the JKQTPlotter), you can already alter the system-wide default styling. It is accessible via the function `JKQTPGetSystemDefaultStyle()`, which returns a reference to the central style object of type `JKQTPlotterStyle`. In the example below, the color of the user-actions (e.g. of the zooming rectangle, that can be drawn with the mouse) is set to red:
```.cpp
int main(int argc, char* argv[])
{
QApplication app(argc, argv);
// you can set the system-wide default style properties early on
// all JKQTPlotter instance created after this, will use these
// settings as their initial settings
JKQTPGetSystemDefaultStyle().userActionFontSize=10;
TestStyling win;
win.show();
return app.exec();
}
```
In addition to `JKQTPGetSystemDefaultStyle()`, which allows to style the `JKQTPlotter` (mainly the GUI-parts and user-action bindings), there is also `JKQTPGetSystemDefaultBaseStyle()`, which accesses a central instance of `JKQTBasePlotterStyle`. The latter object contains the styling of the graph itself (colors, axis properties, ...).
You can also store these settings in an INI-file (or any file supported by [`QSettings`](http://doc.qt.io/qt-5/qsettings.html)) and load such a file on startup, using:
```.cpp
QSettings plotSettings("JKQTPlotterSettings.ini", QSettings::IniFormat);;
JKQTPGetSystemDefaultStyle().loadSettings(plotSettings);
JKQTPGetSystemDefaultBaseStyle().loadSettings(plotSettings);
```
## Apply a new Style to an Existing JKQTPlotter
The major part of the source code of the main application can be found in [`test_styling.cpp`](https://github.com/jkriege2/JKQtPlotter/tree/master/examples/test_styling/test_styling.cpp). It opens a window with a plotter, that contains a set of test graphs to demonstrate the styling. The following function is connected to the "Update Graph"-button and applys the style defined by the INI in the plainTextEdit to the plotter:
```.cpp
void TestStyling::on_btnUpdate_clicked()
{
QApplication::setOverrideCursor(QCursor(Qt::WaitCursor));
// In this function, we store the data from the plainTextEdit into a temporary file
// tmpfn and the use that file's contents to create a QSettings object, which is used
// to read the plotterStyle into the JKQTPlotter-object ui->plot (using loadCurrentPlotterStyle(settings) )
QString tmpfn=QDir::tempPath()+"/jkqtplotter_config.tmp";
{
QFile data(tmpfn);
if (data.open(QFile::WriteOnly|QFile::Text)) {
QTextStream out(&data);
out << ui->plainTextEdit->toPlainText();
}
}
{
QSettings settings(tmpfn, QSettings::IniFormat);
ui->plot->loadCurrentPlotterStyle(settings);
initPlot();
ui->chkDebugBoxes->setChecked(ui->plot->getPlotter()->isDebugShowRegionBoxesEnabled());
}
QFile::remove(tmpfn);
QApplication::restoreOverrideCursor();
}
```
# Some Example Styles
The following gallery shows a set of example styles:
| Style-file | Screenshot |
|:-------------:| ------------- |
| The Default Style | 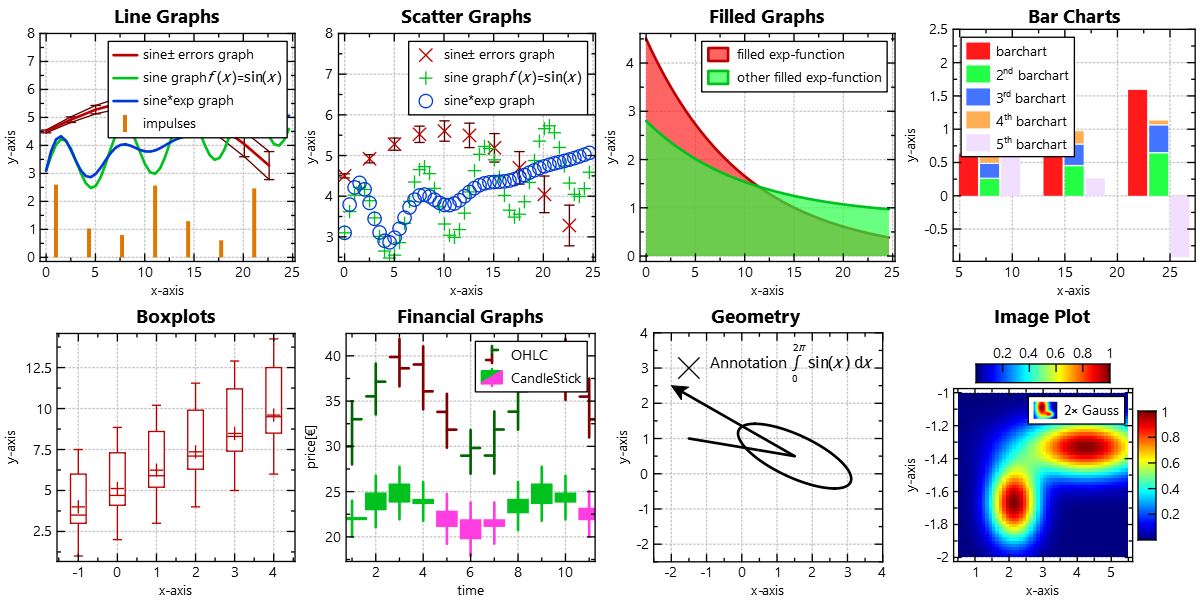 |
| [`lib/jkqtplotter/resources/style/simple_gridandticks.ini`](https://github.com/jkriege2/JKQtPlotter/tree/master/lib/jkqtplotter/resources/styles/simple_gridandticks.ini) | 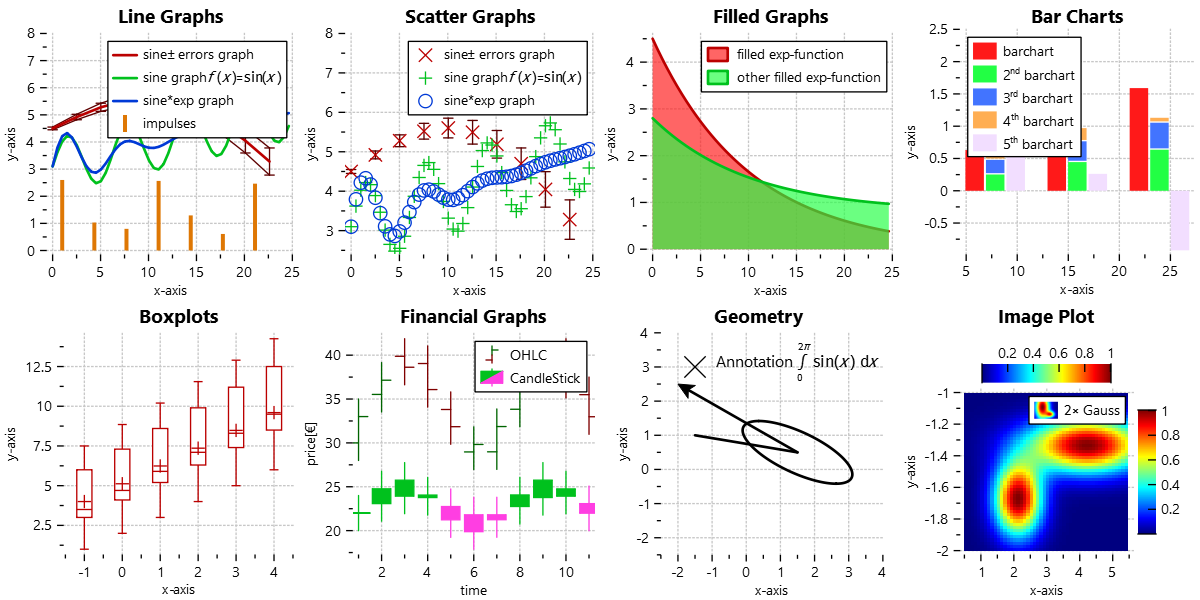 |
| [`lib/jkqtplotter/resources/style/simple_axesoffset.ini`](https://github.com/jkriege2/JKQtPlotter/tree/master/lib/jkqtplotter/resources/styles/simple_axesoffset.ini) |  |
| [`lib/jkqtplotter/resources/style/simple_axesoffset_plotbox.ini`](https://github.com/jkriege2/JKQtPlotter/tree/master/lib/jkqtplotter/resources/styles/simple_axesoffset_plotbox.ini) | 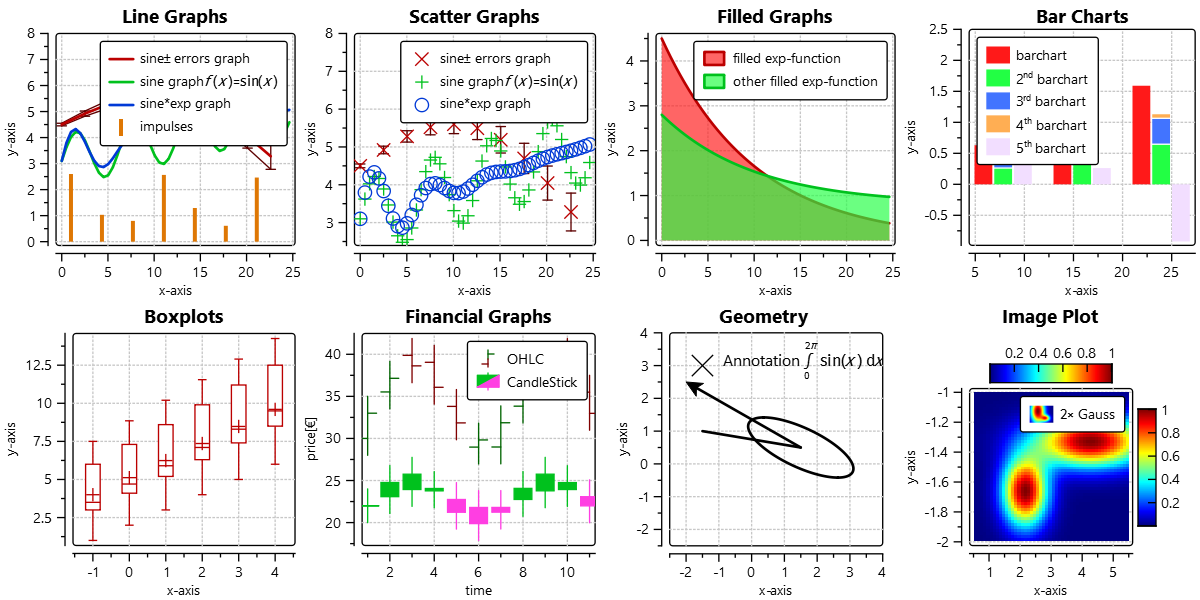 |
| [`lib/jkqtplotter/resources/style/dark.ini`](https://github.com/jkriege2/JKQtPlotter/tree/master/lib/jkqtplotter/resources/styles/dark.ini) | 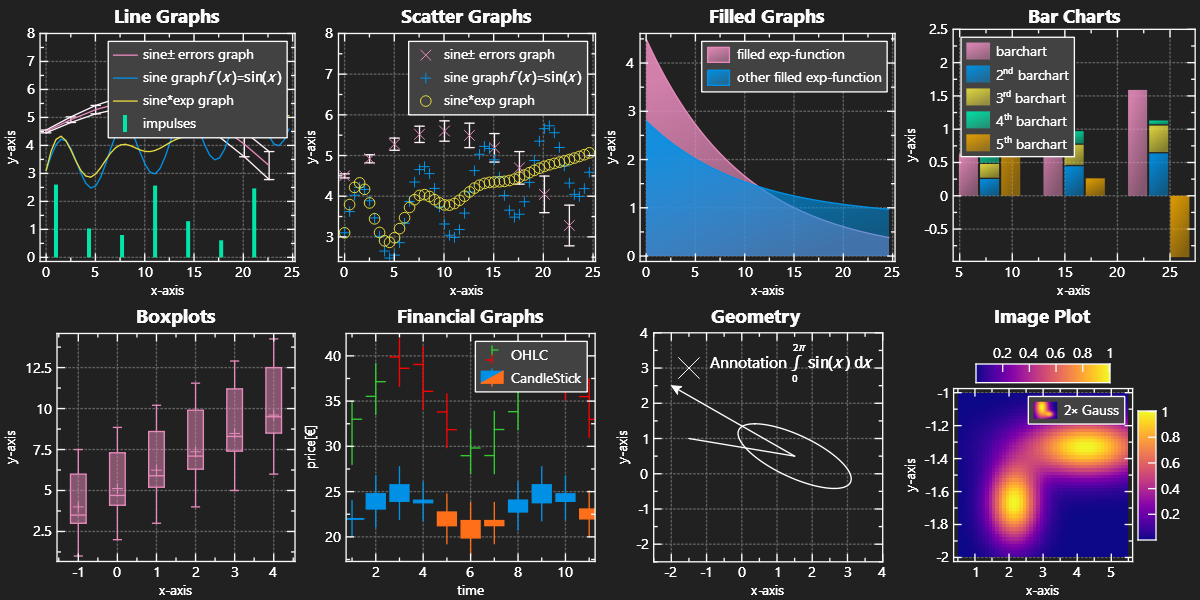 |
| [`lib/jkqtplotter/resources/style/blueprint.ini`](https://github.com/jkriege2/JKQtPlotter/tree/master/lib/jkqtplotter/resources/styles/blueprint.ini) | 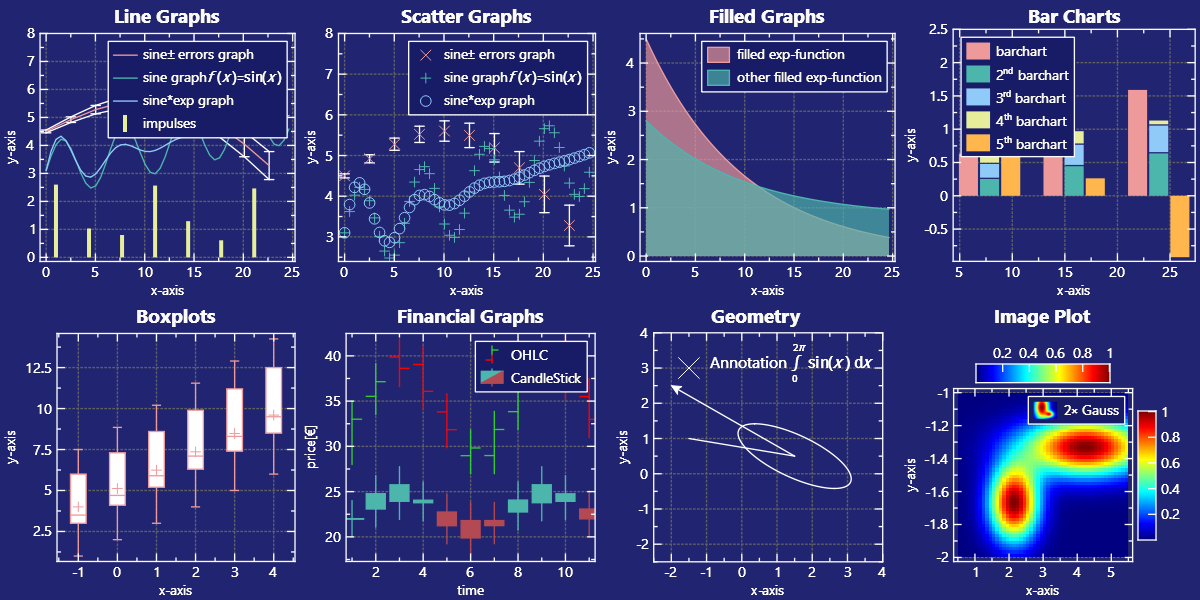 |
| [`lib/jkqtplotter/resources/style/blackandwhite.ini`](https://github.com/jkriege2/JKQtPlotter/tree/master/lib/jkqtplotter/resources/styles/blackandwhite.ini) | 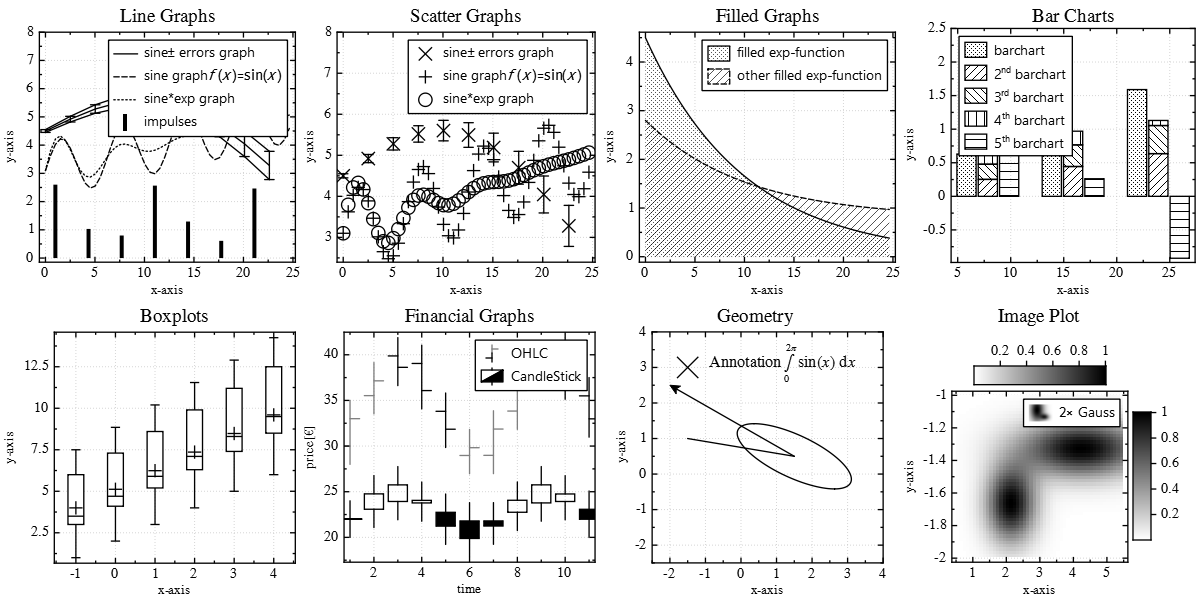 |
| [`lib/jkqtplotter/resources/style/seaborn.ini`](https://github.com/jkriege2/JKQtPlotter/tree/master/lib/jkqtplotter/resources/styles/seaborn.ini) | 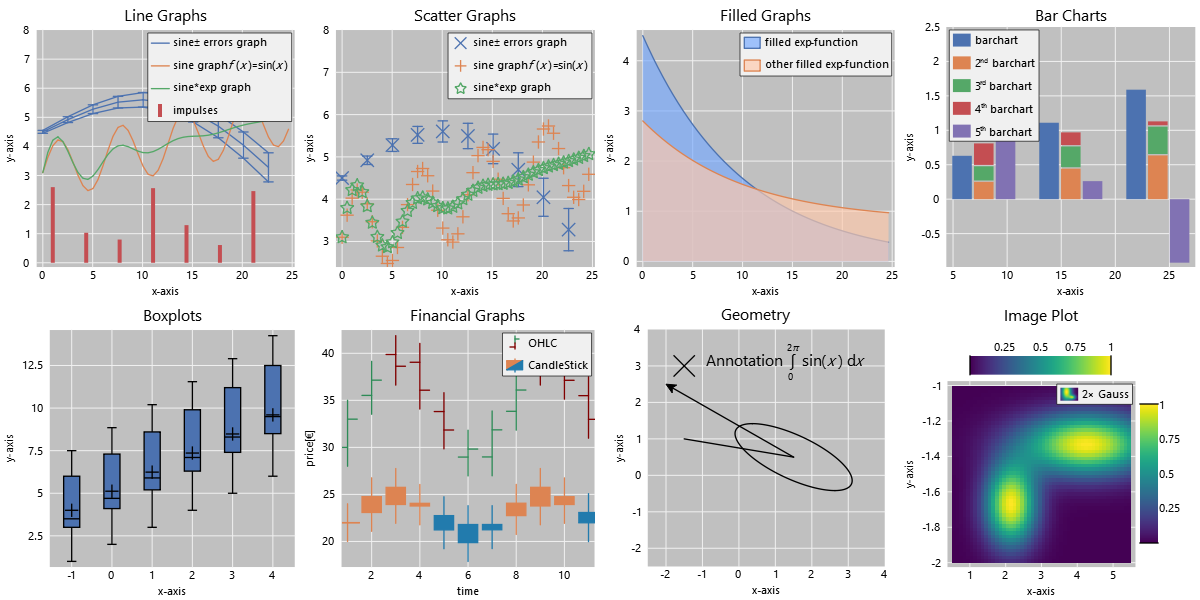 |
Note: The styles listed above are also linked into the executable as Qt ressource ... you can use them e.g. as follows:
```.cpp
QSettings plotSettings(":/JKQTPlotter/styles/blackandwhite.ini", QSettings::IniFormat);;
JKQTPGetSystemDefaultStyle().loadSettings(plotSettings);
JKQTPGetSystemDefaultBaseStyle().loadSettings(plotSettings);
```