# Tutorial (JKQTPlotter): Using a JKQTPlotter inside a Qt User Interface Designer (UI) File {#JKQTPlotterQtCreator}
This project (see `./examples/ui/`) demonstrates how to create add a `JKQTPlotter` inside the Qt Form Editor (e.g. called from of Qt Creator) into a widget.
# Instructions on how to use JKQTPlotter in the Qt Form Designer
For this to work you have to follow the steps shown below:
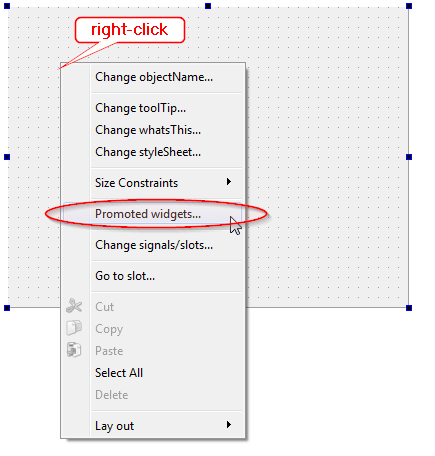
1. add a new UI-file to your project and open it in the Form Editor. Then right-click the form and select `Promote Widgets ...`:<br>
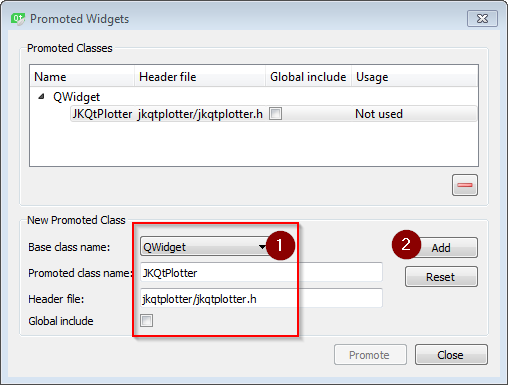
2. In the dialog that opens, you have to define `JKQTPlotter` as a promotion to `QWidget` as shown below. Finally store the settings by clicking `Add` and closing the dialog with `Close`.<br>
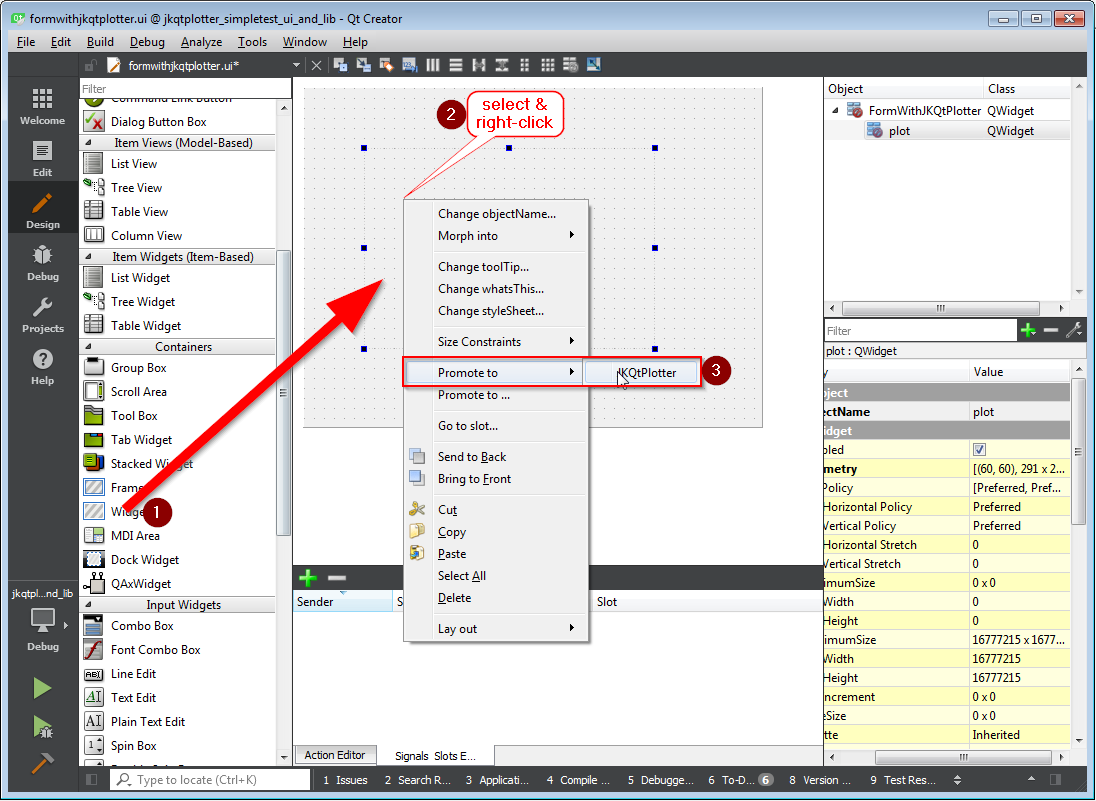
3. Now you can add a `QWidget`from the side-bar to the form and then promote it to `JKQTPlotter`, by selecting and right-clicking the `QWidget` and then selecting `Promote To | JKQTPlotter`:<br>
# QMake-Project of this example
The QMake project for such a project looks like this (see [`ui.pro`](https://github.com/jkriege2/JKQtPlotter/tree/master/examples/ui/ui.pro):
```.qmake
# source code for this simple demo
SOURCES = ui.cpp \
formwithjkqtplotter.cpp
FORMS += formwithjkqtplotter.ui
HEADERS += formwithjkqtplotter.h
# configure Qt
CONFIG += qt
QT += core gui xml svg
greaterThan(QT_MAJOR_VERSION, 4): QT += widgets printsupport
# output executable name
TARGET = ui
# include JKQTPlotter source headers and link against library
DEPENDPATH += ../../lib ../../qmake/staticlib/jkqtplotterlib
INCLUDEPATH += ../../lib
CONFIG (debug, debug|release) {
LIBS += -L../../qmake/staticlib/jkqtplotterlib/debug -ljkqtplotterlib_debug
} else {
LIBS += -L../../qmake/staticlib/jkqtplotterlib/release -ljkqtplotterlib
}
message("LIBS = $$LIBS")
win32-msvc*: DEFINES += _USE_MATH_DEFINES
win32-msvc*: DEFINES += NOMINMAX
```
As you can see there is a main CPP-file (shown below) and a `formwithjkqtplotter.ui`-file with the `formwithjkqtplotter.cpp/.h`-files that are used to implement the functionality behind the form (see next chapter).
The source code of the main application is simply instanciating the Form class `FormWithJKQTPlotter` from `formwithjkqtplotter.ui/.h/.cpp`:
```.cpp
#include <QApplication>
#include "formwithjkqtplotter.h"
int main(int argc, char* argv[])
{
QApplication app(argc, argv);
FormWithJKQTPlotter plot;
plot.show();
plot.resize(600,400);
return app.exec();
}
```
# Form Class `FormWithJKQTPlotter`
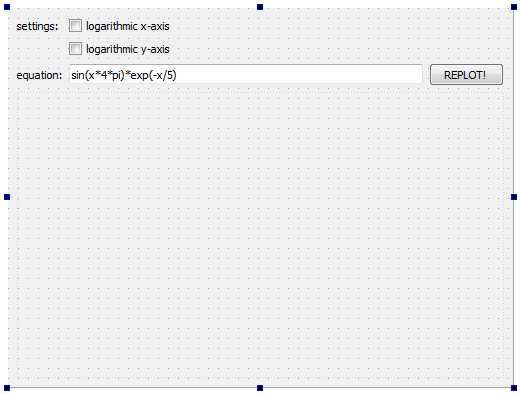
The Form was designed in the Qt Form Designer within Qt Creator, using the method described above (see `formwithjkqtplotter.ui`):
In addition the example implements some simple functionality in the `formwithjkqtplotter.cpp/.h`-files. A single graph, which parses and plots a function (from a `QLineEdit`) is added to the plot in the constructor:
```.cpp
#include "formwithjkqtplotter.h"
#include "ui_formwithjkqtplotter.h"
FormWithJKQTPlotter::FormWithJKQTPlotter(QWidget *parent) :
QWidget(parent),
ui(new Ui::FormWithJKQTPlotter)
{
ui->setupUi(this);
graph=new JKQTPXParsedFunctionLineGraph(ui->plot);
graph->setFunction(ui->edtEquation->text());
graph->setTitle(ui->edtEquation->text());
ui->plot->addGraph(graph);
ui->plot->setXY(-10,10,-10,10);
}
```
Then three slots react to user interactions. First two interactions set the x- or y-axis to linear or logarithmic, depending on the state of the two check-boxes. It also sets the scaling of the axes to meaningful default values:
```.cpp
void FormWithJKQTPlotter::on_chkLogX_toggled(bool checked)
{
ui->plot->getXAxis()->setLogAxis(checked);
if (checked) {
ui->plot->setX(1e-3,10);
} else {
ui->plot->setX(-10,10);
}
}
void FormWithJKQTPlotter::on_chkLogY_toggled(bool checked)
{
ui->plot->getYAxis()->setLogAxis(checked);
if (checked) {
ui->plot->setY(1e-3,10);
} else {
ui->plot->setY(-10,10);
}
}
```
A third slot is connected to the `clicked()`-event of the `QPushButton` labeled "REPLOT!". This slot reads the function from the `QLineEdit` and updates the plot with it:
```.cpp
void FormWithJKQTPlotter::on_btnReplot_clicked()
{
graph->setFunction(ui->edtEquation->text());
graph->setTitle(ui->edtEquation->text());
ui->plot->redrawPlot();
}
```
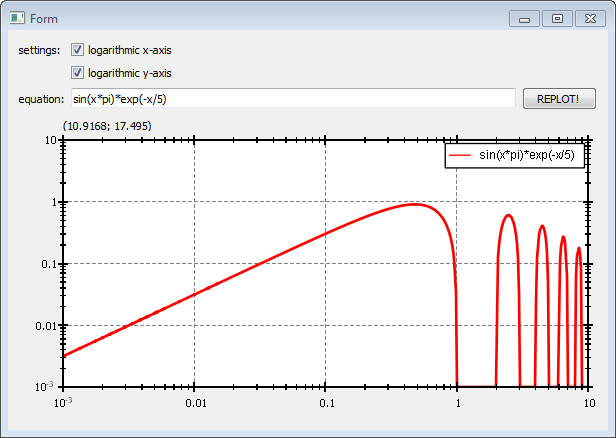
The result looks like this:
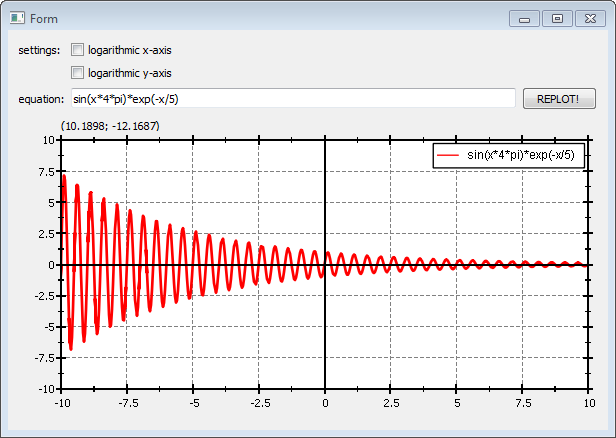
If you set both axes to logarithmic and modify the plotted function a bit, you get: