mirror of
https://github.com/jkriege2/JKQtPlotter.git
synced 2024-11-15 18:15:52 +08:00
63 lines
2.8 KiB
Markdown
63 lines
2.8 KiB
Markdown
|
|
# Example (JKQTPlotter): Barchart With Error Bars {#JKQTPlotterBarchartsErrorBars}
|
||
|
|
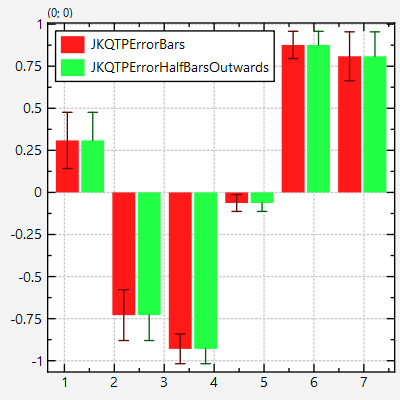
This project (see [`barchart_errorbars`](https://github.com/jkriege2/JKQtPlotter/tree/master/examples/barchart_errorbars) shows how to draw barcharts with different styles of error indicators.
|
||
|
|
|
||
|
|
The source code of the main application is (see [`barchart_errorbars.cpp`](https://github.com/jkriege2/JKQtPlotter/tree/master/examples/barchart_errorbars/barchart_errorbars.cpp):
|
||
|
|
```.cpp
|
||
|
|
// 1. create a plotter window and get a pointer to the internal datastore (for convenience)
|
||
|
|
JKQTPDatastore* ds=plot.getDatastore();
|
||
|
|
|
||
|
|
// 2. now we create three columns for key and value
|
||
|
|
size_t columnK=ds->addLinearColumn(6, 0.4*JKQTPSTATISTICS_PI, 2.2*JKQTPSTATISTICS_PI,"k");
|
||
|
|
size_t columnV=ds->addColumnCalculatedFromColumn(columnK, &cos, "v");
|
||
|
|
size_t columnE=ds->addColumnCalculatedFromColumn(columnK, [](double x) { return 0.05+0.06*(1.0+sin(x)); }, "error");
|
||
|
|
|
||
|
|
// 3. create a graph in the plot, which plots the dataset with symmetric:
|
||
|
|
JKQTPBarVerticalErrorGraph* graph1=new JKQTPBarVerticalErrorGraph(&plot);
|
||
|
|
graph1->setKeyColumn(columnK);
|
||
|
|
graph1->setValueColumn(columnV);
|
||
|
|
graph1->setBarErrorColumn(columnE);
|
||
|
|
// set error indicator style
|
||
|
|
graph1->setBarErrorStyle(JKQTPErrorBars);
|
||
|
|
graph1->setTitle(QObject::tr("JKQTPErrorBars"));
|
||
|
|
plot.addGraph(graph1);
|
||
|
|
|
||
|
|
// 4. create a second graph in the plot, which plots the second dataset with outer error bars only:
|
||
|
|
JKQTPBarVerticalErrorGraph* graph2=new JKQTPBarVerticalErrorGraph(&plot);
|
||
|
|
graph2->setKeyColumn(columnK);
|
||
|
|
graph2->setValueColumn(columnV);
|
||
|
|
graph2->setBarErrorColumn(columnE);
|
||
|
|
// set error indicator style
|
||
|
|
graph2->setBarErrorStyle(JKQTPErrorHalfBarsOutwards);
|
||
|
|
graph2->setTitle(QObject::tr("JKQTPErrorHalfBarsOutwards"));
|
||
|
|
plot.addGraph(graph2);
|
||
|
|
|
||
|
|
// 5. now we set the graphs, so they are plotted side-by-side
|
||
|
|
// This function searches all JKQTPBarHorizontalGraph in the current
|
||
|
|
// plot and sets their shift/scale so they form a nice plot with
|
||
|
|
// side-by-side groups
|
||
|
|
graph1->autoscaleBarWidthAndShift(0.9, 0.9);
|
||
|
|
|
||
|
|
|
||
|
|
// 6 autoscale the plot so the graph is contained
|
||
|
|
plot.zoomToFit();
|
||
|
|
|
||
|
|
// 7. show plotter and make it a decent size
|
||
|
|
plot.getPlotter()->setKeyPosition(JKQTPKeyInsideTopLeft);
|
||
|
|
plot.setWindowTitle(title);
|
||
|
|
plot.show();
|
||
|
|
plot.resize(400,400);
|
||
|
|
```
|
||
|
|
|
||
|
|
|
||
|
|
The result looks like this:
|
||
|
|
|
||
|
|

|
||
|
|
|
||
|
|
|
||
|
|
|
||
|
|
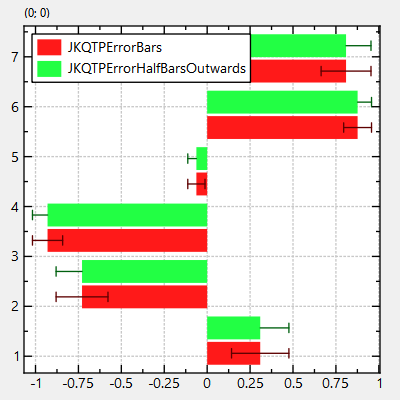
In order to draw horizontal error bars, you have to use `JKQTPBarHorizontalErrorGraph` instead of `JKQTPBarVerticalErrorGraph`:
|
||
|
|
|
||
|
|

|
||
|
|
|
||
|
|
|