mirror of
https://github.com/jkriege2/JKQtPlotter.git
synced 2025-01-13 01:10:33 +08:00
64 lines
3.0 KiB
Markdown
64 lines
3.0 KiB
Markdown
|
|
# Example (JKQTPlotter): Vector Field Plot Example {#JKQTPParametrizedVectorFieldGraphExample}
|
||
|
|
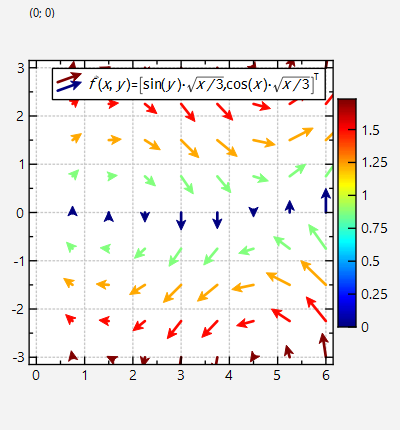
This project (see [`paramvectorfield`](https://github.com/jkriege2/JKQtPlotter/tree/master/examples/paramvectorfield) demonstrates the use of JKQTPParametrizedVectorFieldGraph to visualize a vector field with additional information encoded in the color of the vectors.
|
||
|
|
|
||
|
|
The source code of the main application is (see [`paramvectorfield.cpp`](https://github.com/jkriege2/JKQtPlotter/tree/master/examples/paramvectorfield/paramvectorfield.cpp).
|
||
|
|
|
||
|
|
Here is a short summary of the important parts of the code:
|
||
|
|
|
||
|
|
```.cpp
|
||
|
|
// 1. setup a plotter window and get a pointer to the internal datastore (for convenience)
|
||
|
|
JKQTPlotter plot;
|
||
|
|
JKQTPDatastore* ds=plot.getDatastore();
|
||
|
|
|
||
|
|
|
||
|
|
// 2. make up some arbitrary data to be used for plotting
|
||
|
|
// this generates a 2D grid of x/y-coordinates and then calculates dx=cos(y)*sqrt(x/3.0) and dy=sin(x)*sqrt(x/3.0)
|
||
|
|
const auto columnXY=ds->addLinearGridColumns(NX, 0, 6, NY, -3, 3,"x","y");
|
||
|
|
const auto columnDX=ds->addCalculatedColumnFromColumn(columnXY.first, columnXY.second, [](double x,double y) { return sin(y)*sqrt(x/3.0); });
|
||
|
|
const auto columnDY=ds->addCalculatedColumnFromColumn(columnXY.first, columnXY.second, [](double x,double y) { return cos(x)*sqrt(x/3.0); });
|
||
|
|
// now we also calulate a column that encodes some other information that can be color-coded
|
||
|
|
const auto columnC=ds->addCalculatedColumnFromColumn(columnXY.first, columnXY.second, [](double x,double y) { return sqrt(fabs(y)); });
|
||
|
|
|
||
|
|
|
||
|
|
// 3. create JKQTPVectorFieldGraph to display the data:
|
||
|
|
JKQTPParametrizedVectorFieldGraph* graph1=new JKQTPParametrizedVectorFieldGraph(&plot);
|
||
|
|
graph1->setXYColumns(columnXY);
|
||
|
|
graph1->setDxColumn(columnDX);
|
||
|
|
graph1->setDyColumn(columnDY);
|
||
|
|
graph1->setColorColumn(columnC);
|
||
|
|
graph1->setTitle(QObject::tr("$\\vec{f}(x,y)=\\bigl[\\sin(y)\\cdot\\sqrt{x/3}, \\cos(x)\\cdot\\sqrt{x/3}\\bigr]^\\mathrm{T}$"));
|
||
|
|
|
||
|
|
// 4. add the graphs to the plot, so it is actually displayed
|
||
|
|
plot.addGraph(graph1);
|
||
|
|
|
||
|
|
```
|
||
|
|
|
||
|
|
The result looks like this:
|
||
|
|
|
||
|
|

|
||
|
|
|
||
|
|
|
||
|
|
By default, the color of the drawn vector is determined from the color column provided to the graph object.
|
||
|
|
But you can also choose to not provide a color column and instead set
|
||
|
|
|
||
|
|
```.cpp
|
||
|
|
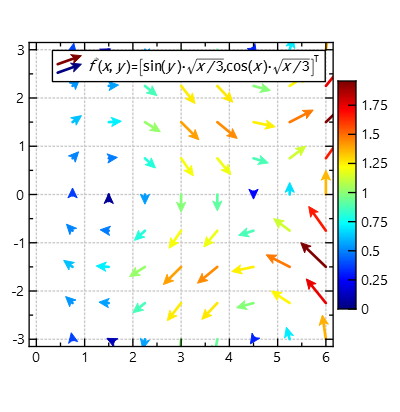
graph1->setVectorColorMode(JKQTPParametrizedVectorFieldGraph::ColorFromMagnitude);
|
||
|
|
```
|
||
|
|
|
||
|
|
Now the color encodes the actual length (or magnitude) of the vectors:
|
||
|
|
|
||
|
|

|
||
|
|
|
||
|
|
|
||
|
|
Alternatively
|
||
|
|
|
||
|
|
```.cpp
|
||
|
|
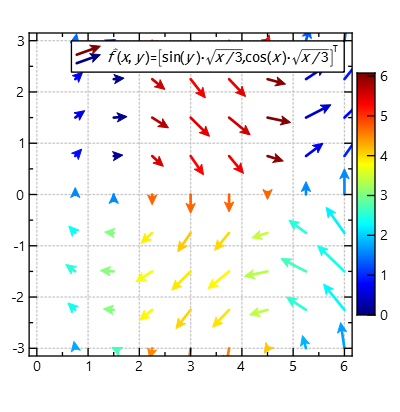
graph1->setVectorColorMode(JKQTPParametrizedVectorFieldGraph::ColorFromAngle);
|
||
|
|
```
|
||
|
|
|
||
|
|
will color-encode the rotation angle (in radians, 3 o'clock is 0rad) of the vectors:
|
||
|
|
|
||
|
|

|
||
|
|
|
||
|
|
|