This project (see `./examples/errorbarstyles/`) simply creates a JKQTPlotter widget (as a new window) and adds several curves show-casing different styles of error indicators. Data is initialized from two QVector<double> objects.
[JKQTPlotterBasicJKQTPDatastoreStatisticsGroupedStat]: @ref JKQTPlotterBasicJKQTPDatastoreStatisticsGroupedStat "1-Dimensional Group Statistics with JKQTPDatastore"
***Note:*** This examples explains how to plot graphs with error indicators, when the data has already been calculated. The tutorial [JKQTPlotterBasicJKQTPDatastoreStatisticsGroupedStat] explains one way how to use the [statisticslibrary] in order to calculate the errors from data.
The source code of the main application can be found in [`errorbarstyles.cpp`](https://github.com/jkriege2/JKQtPlotter/tree/master/examples/errorbarstyles/errorbarstyles.cpp).
First some data is added to the internal datastore (mostly, like explained in several other examples, like e.g. [Line Graph with Different Symbols and Line Styles](https://github.com/jkriege2/JKQtPlotter/tree/master/examples/symbols_and_styles)). The (in a loop) several graphs are added, each with a distinct style for its error indicators:
There are more properties that you can find in the documentation of the mix-in classes `JKQTPXYGraphErrors`, `JKQTPXGraphErrors`, `JKQTPYGraphErrors`, `JKQTPGraphErrors`.
Error bars are implemented in the mixin-classes `JKQTPXYGraphErrors`, `JKQTPXGraphErrors` and `JKQTPYGraphErrors` that are all derived from `JKQTPGraphErrors`. With these it is simple to add error indicators to several different plot styles. Usually you can recognize these by looking at the class name, e.g. `JKQTPXYLineGraph` is a simple line+symbol graph, and `JKQTPXYLineErrorGraph` is the same with error indictaors (see above). There are also several other plots with error indicators:
-`JKQTPBarVerticalErrorGraph` for barcharts with errors:<br>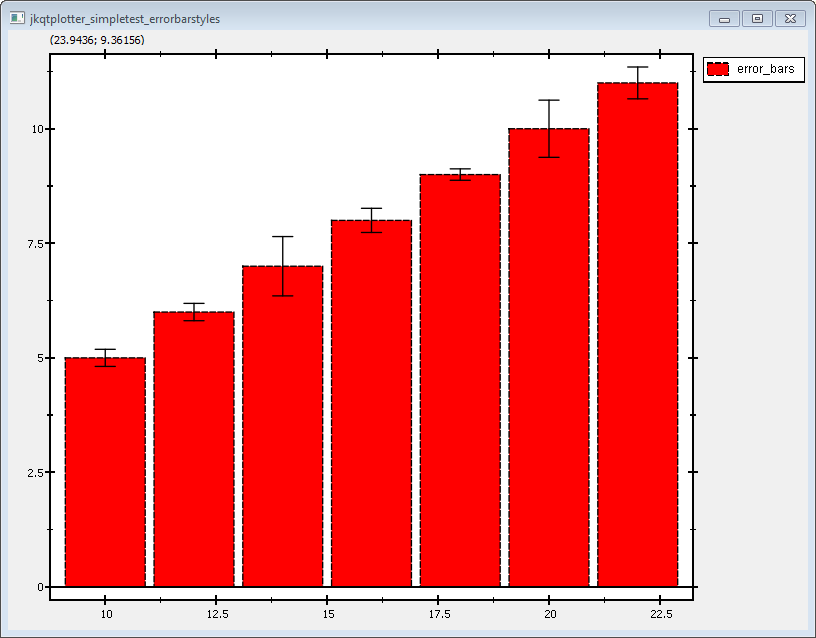
-`JKQTPImpulsesVerticalGraph` for impulse/candle-stick charts with errors:<br>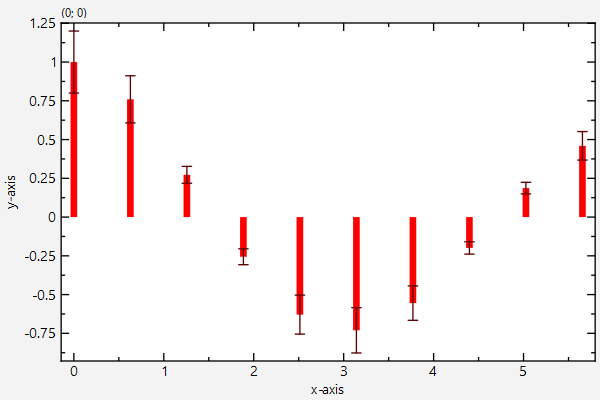
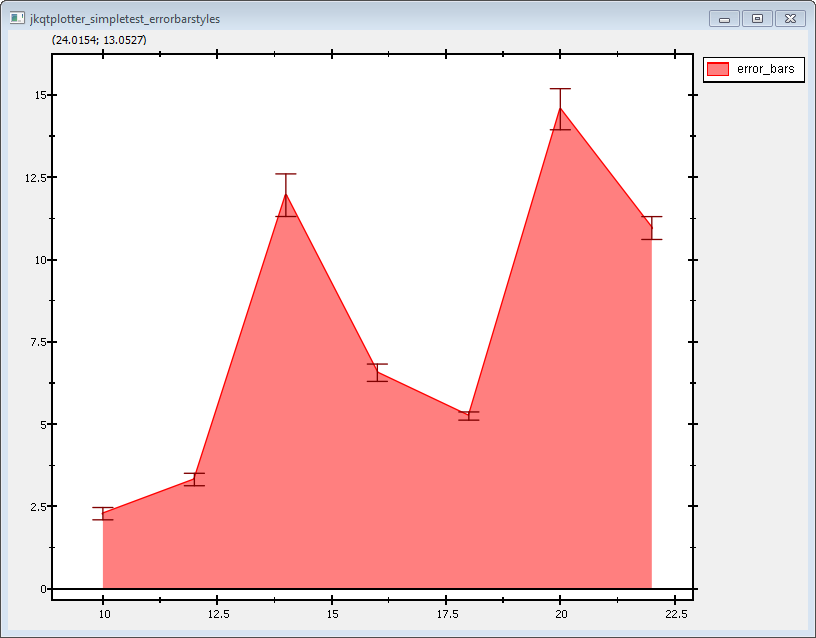
-`JKQTPFilledCurveXErrorGraph` for filled curves with errors:<br>