mirror of
https://github.com/jkriege2/JKQtPlotter.git
synced 2024-11-15 18:15:52 +08:00
111 lines
5.5 KiB
Markdown
111 lines
5.5 KiB
Markdown
|
|
# Example (JKQTPlotter): Multi-Threaded (Parallel) Plotting {#JKQTPlotterMultiThreaded}
|
||
|
|
This project (see `./examples/multithreaded/`) shows how to use JKQTBasePlotter in multiple threads in parallel.
|
||
|
|
|
||
|
|
The source code of the main application can be found in [`multithreaded.cpp`](https://github.com/jkriege2/JKQtPlotter/tree/master/examples/multithreaded/multithreaded.cpp) and [`multithreaded_thread.cpp`](https://github.com/jkriege2/JKQtPlotter/tree/master/examples/multithreaded/multithreaded_thread.cpp).
|
||
|
|
|
||
|
|
The file [`multithreaded_thread.cpp`](https://github.com/jkriege2/JKQtPlotter/tree/master/examples/multithreaded/multithreaded_thread.cpp) contains a [`QThread`](https://doc.qt.io/qt-6/qthread.html) class that implements the actual plotting within a static method that is also run inside the thread's [`QThread::run()`](https://doc.qt.io/qt-6/qthread.html#run) method. It generates a plot with several line-graphs and then saves them into a PNG-file:
|
||
|
|
|
||
|
|
```.cpp
|
||
|
|
public:
|
||
|
|
inline static QString plotAndSave(const QString& filenamepart, int plotIndex, int NUM_GRAPHS, int NUM_DATAPOINTS, double* runtimeNanoseconds=nullptr) {
|
||
|
|
QElapsedTimer timer;
|
||
|
|
timer.start();
|
||
|
|
const QString filename=QDir(QDir::tempPath()).absoluteFilePath(QString("testimg_%1_%2.png").arg(filenamepart).arg(plotIndex));
|
||
|
|
JKQTBasePlotter plot(true);
|
||
|
|
|
||
|
|
const size_t colX=plot.getDatastore()->addLinearColumn(NUM_DATAPOINTS, 0, 10, "x");
|
||
|
|
QRandomGenerator rng;
|
||
|
|
for (int i=0; i<NUM_GRAPHS; i++) {
|
||
|
|
JKQTPXYLineGraph* g;
|
||
|
|
plot.addGraph(g=new JKQTPXYLineGraph(&plot));
|
||
|
|
g->setXColumn(colX);
|
||
|
|
g->setYColumn(plot.getDatastore()->addColumnCalculatedFromColumn(colX, [&](double x) { return cos(x+double(i)/8.0*JKQTPSTATISTICS_PI)+rng.generateDouble()*0.2-0.1;}));
|
||
|
|
g->setTitle(QString("Plot %1: $f(x)=\\cos\\leftx+\\frac{%1\\pi}{8}\\right)").arg(i+1));
|
||
|
|
g->setDrawLine(true);
|
||
|
|
g->setSymbolType(JKQTPNoSymbol);
|
||
|
|
|
||
|
|
}
|
||
|
|
plot.setPlotLabel(QString("Test Plot %1").arg(plotIndex+1));
|
||
|
|
plot.getXAxis()->setAxisLabel("x-axis");
|
||
|
|
plot.getYAxis()->setAxisLabel("y-axis");
|
||
|
|
plot.zoomToFit();
|
||
|
|
plot.saveAsPixelImage(filename, false, "PNG");
|
||
|
|
|
||
|
|
if (runtimeNanoseconds) *runtimeNanoseconds=timer.nsecsElapsed();
|
||
|
|
return filename;
|
||
|
|
}
|
||
|
|
|
||
|
|
// ...
|
||
|
|
|
||
|
|
protected:
|
||
|
|
inline virtual void run() {
|
||
|
|
m_filename=plotAndSave(m_filenamepart, m_plotindex, m_NUM_GRAPHS, m_NUM_DATAPOINTS, &m_runtimeNanoseconds);
|
||
|
|
}
|
||
|
|
```
|
||
|
|
|
||
|
|
The main application in [`multithreaded.cpp`](https://github.com/jkriege2/JKQtPlotter/tree/master/examples/multithreaded/multithreaded.cpp) then uses this method/thread-class to perform a test: First the function is run several times serially and then an equal amount of times in parallel.
|
||
|
|
|
||
|
|
```.cpp
|
||
|
|
#define NUM_PLOTS 8
|
||
|
|
#define NUM_GRAPHS 6
|
||
|
|
#define NUM_DATAPOINTS 1000
|
||
|
|
|
||
|
|
QElapsedTimer timer;
|
||
|
|
|
||
|
|
/////////////////////////////////////////////////////////////////////////////////
|
||
|
|
// serial plotting
|
||
|
|
/////////////////////////////////////////////////////////////////////////////////
|
||
|
|
timer.start();
|
||
|
|
for (int i=0; i<NUM_PLOTS; i++) {
|
||
|
|
PlottingThread::plotAndSave("serial", i, NUM_GRAPHS, NUM_DATAPOINTS);
|
||
|
|
}
|
||
|
|
const double durSerialNano=timer.nsecsElapsed();
|
||
|
|
qDebug()<<"durSerial = "<<durSerialNano/1e6<<"ms";
|
||
|
|
|
||
|
|
|
||
|
|
|
||
|
|
/////////////////////////////////////////////////////////////////////////////////
|
||
|
|
// parallel plotting
|
||
|
|
/////////////////////////////////////////////////////////////////////////////////
|
||
|
|
QList<QSharedPointer<PlottingThread>> threads;
|
||
|
|
for (int i=0; i<NUM_PLOTS; i++) {
|
||
|
|
qDebug()<<" creating thread "<<i;
|
||
|
|
threads.append(QSharedPointer<PlottingThread>::create("parallel",i, NUM_GRAPHS, NUM_DATAPOINTS, nullptr));
|
||
|
|
}
|
||
|
|
timer.start();
|
||
|
|
for (int i=0; i<NUM_PLOTS; i++) {
|
||
|
|
qDebug()<<" staring thread "<<i;
|
||
|
|
threads[i]->start();
|
||
|
|
}
|
||
|
|
for (int i=0; i<NUM_PLOTS; i++) {
|
||
|
|
qDebug()<<" waiting for thread "<<i;
|
||
|
|
threads[i]->wait();
|
||
|
|
}
|
||
|
|
const double durParallelNano=timer.nsecsElapsed();
|
||
|
|
qDebug()<<"durParallel = "<<durParallelNano/1e6<<"ms";
|
||
|
|
|
||
|
|
threads.clear();
|
||
|
|
```
|
||
|
|
|
||
|
|
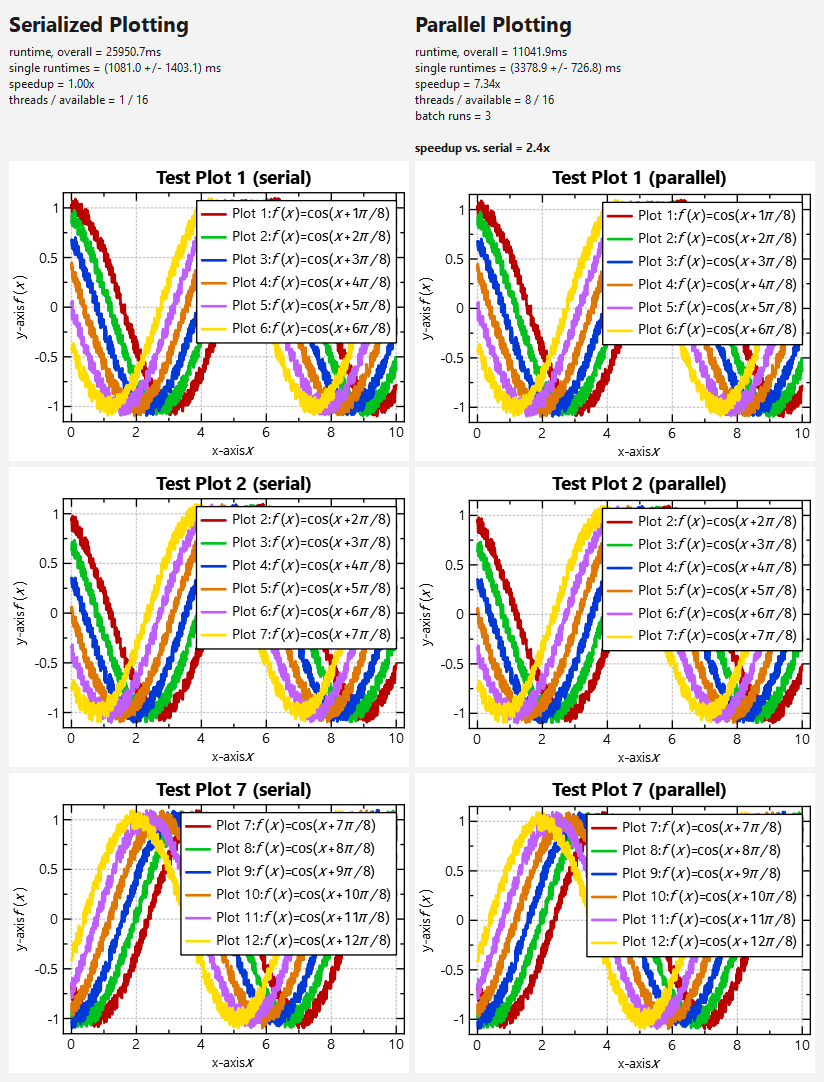
This test results in the following numbers (on my AMD Ryzen5 8/16-core laptop):
|
||
|
|
|
||
|
|
[comment]:RESULTS
|
||
|
|
|
||
|
|
<u><b>SERIAL RESULTS:</b></u><br/>runtime, overall = 1719.3ms<br/>single runtimes = (214.8 +/- 277.4) ms<br/>speedup = 1.00x<br/>threads / available = 1 / 16<br/><br/>
|
||
|
|
|
||
|
|
<u><b>PARALLEL RESULTS:</b></u><br/>
|
||
|
|
runtime, overall = 649.1ms<br/>single runtimes = (605.2 +/- 81.8) ms<br/>speedup = 7.46x<br/>threads / available = 8 / 16<br/><br/><b>speedup vs. serial = 2.6x</b>
|
||
|
|
|
||
|
|
[comment]:RESULTS_END
|
||
|
|
|
||
|
|
From this data you can observe:
|
||
|
|
- The plotting parallelizes nicely, i.e. the speedup ist >7x on a 8-core-machine. This is the speedup calculated as sum of runtimes of each thread, divided by the runtime of all threads in parallel.
|
||
|
|
- BUT: the speedup of serialized plotting vs. parallel plotting is way smaller: It is only 2-3x. This can be explained by the (significant) overhead due to shared caches (and therefore synchronization) between the plotters. This may be reworked in future!
|
||
|
|
- The variance in runtimes in the (initial) serial test-run is larger than in the parallel run. This is due to filling of the internal caches during the first plotting!
|
||
|
|
.
|
||
|
|
|
||
|
|
Finally the application displays the plots:
|
||
|
|
|
||
|
|

|
||
|
|
|