mirror of
https://github.com/jkriege2/JKQtPlotter.git
synced 2025-01-25 06:59:28 +08:00
150 lines
5.8 KiB
Markdown
150 lines
5.8 KiB
Markdown
|
|
# Example (JKQTPlotter): Wiggle Plots {#JKQTPlotterWigglePlots}
|
||
|
|
|
||
|
|
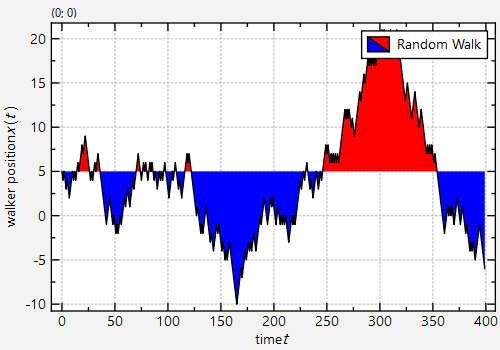
This project (see `./examples/wiggleplots/`) demonstrates how to draw "wiggle plots" with JKQtPlotter, using `JKQTPFilledCurveXGraph` or `JKQTPFilledCurveYGraph`. Wiggle plots are plots, where the fill color is different above and below the baseline of the plot. They are e.g. used in seismology.
|
||
|
|
|
||
|
|
The source code of the main application can be found in [`wiggleplots.cpp`](https://github.com/jkriege2/JKQtPlotter/tree/master/examples/wiggleplots/wiggleplots.cpp). If creates two different plots that demonstrate two styles of plots and also uses the horizontal and vertical variant of the graph class.
|
||
|
|
|
||
|
|
## Plot red/blue wiggle plot using `JKQTPFilledCurveXGraph`
|
||
|
|
|
||
|
|
For the first example we simulate a 1D random walk and plot the result as a filles wiggle plot:
|
||
|
|
|
||
|
|
In a first step, we obtain a pointer to the JKQTPDatastore and add two columns to it.
|
||
|
|
```.cpp
|
||
|
|
// 1. get a pointer to the internal datastore (for convenience)
|
||
|
|
JKQTPDatastore* ds=plot.getDatastore();
|
||
|
|
|
||
|
|
// 2. now we create 2 datacolumns with length 1000 (NSteps) entries in the datastore
|
||
|
|
// these will later hold the time-step and position of a random walker
|
||
|
|
const size_t NSteps=400;
|
||
|
|
const size_t columnT=ds->addLinearColumn(NSteps, 0, NSteps-1, "time");
|
||
|
|
const size_t columnX=ds->addColumn(NSteps, "position");
|
||
|
|
```
|
||
|
|
|
||
|
|
Now we fill the column with the random walk data:
|
||
|
|
|
||
|
|
```.cpp
|
||
|
|
// 3. now we simulate a simple rendom walk and store the calculated positions
|
||
|
|
// in columnX
|
||
|
|
double pos=5;
|
||
|
|
const double stepsize=1;
|
||
|
|
std::random_device rd; // random number generators:
|
||
|
|
std::mt19937 gen{rd()};
|
||
|
|
std::uniform_int_distribution<int> dist(0,1);
|
||
|
|
|
||
|
|
for (size_t t=0; t<NSteps; t++) {
|
||
|
|
ds->set(columnX, t, pos);
|
||
|
|
pos=pos+stepsize*(static_cast<double>(dist(gen))*2.0-1.0);
|
||
|
|
}
|
||
|
|
```
|
||
|
|
|
||
|
|
Now we can generate the actual graph and set its basic properties and data columns:
|
||
|
|
|
||
|
|
```.cpp
|
||
|
|
// 4. now we add three semi-transparent, filled curve plots, one for each histogram
|
||
|
|
JKQTPFilledCurveXGraph* graph=new JKQTPFilledCurveXGraph(&plot);
|
||
|
|
|
||
|
|
// 5. set graph titles
|
||
|
|
graph->setTitle("Random Walk");
|
||
|
|
|
||
|
|
// 6. set data
|
||
|
|
graph->setXColumn(columnT); graph->setYColumn(columnX);
|
||
|
|
```
|
||
|
|
|
||
|
|
Now we can acrivate the wiggle plot style filling mode and set the fill colors and line color and width.
|
||
|
|
|
||
|
|
```.cpp
|
||
|
|
// 7.1 enable wiggle-plot filling
|
||
|
|
graph->setFillMode(JKQTPFilledCurveXGraph::TwoColorFilling);
|
||
|
|
// 7.2 draw the data also as a black, thin line
|
||
|
|
graph->setLineColor(QColor("black"));
|
||
|
|
graph->setLineWidth(1);
|
||
|
|
// 7.3 fill areas below the baseline with red
|
||
|
|
graph->setFillColor(QColor("red"));
|
||
|
|
// 7.4 fill areas above the baseline with blue
|
||
|
|
graph->fillStyleBelow().setFillColor(QColor("blue"));
|
||
|
|
```
|
||
|
|
|
||
|
|
The baseline is set to the starting point (5) of the random walk. By default it would be at y=0.
|
||
|
|
|
||
|
|
```.cpp
|
||
|
|
// 7.5 set the baseline to be at 5 (not the default 0
|
||
|
|
graph->setBaseline(5);
|
||
|
|
```
|
||
|
|
|
||
|
|
Now we only have to add the graph to the plotter and set some final properties for styling:
|
||
|
|
|
||
|
|
```.cpp
|
||
|
|
// 8. add the graphs to the plot, so they are actually displayed
|
||
|
|
plot.addGraph(graph);
|
||
|
|
|
||
|
|
// 9. set axis labels
|
||
|
|
plot.getXAxis()->setAxisLabel("time $t$");
|
||
|
|
plot.getYAxis()->setAxisLabel("walker position $x(t)$");
|
||
|
|
|
||
|
|
// 10. scale plot automatically
|
||
|
|
plot.zoomToFit();
|
||
|
|
|
||
|
|
// 11. show plotter and make it a decent size
|
||
|
|
plot.show();
|
||
|
|
plot.resize(600,400);
|
||
|
|
```
|
||
|
|
|
||
|
|
This is the resulting plot:
|
||
|
|
|
||
|
|

|
||
|
|
|
||
|
|
|
||
|
|
## Plot black/transparent wiggle plot using `JKQTPFilledCurveYGraph` in a "seismographic style"
|
||
|
|
|
||
|
|
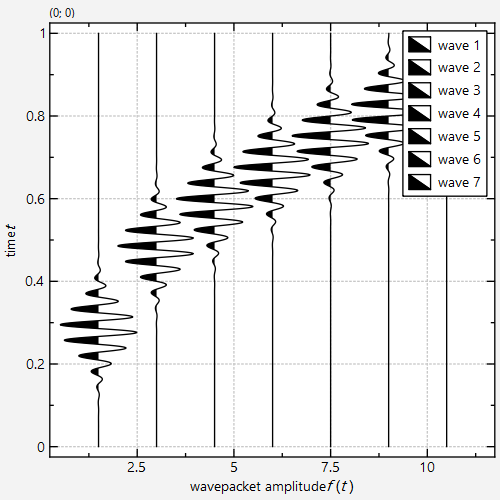
The second example follows mor or less the same steps as above, but here we add several graphs that each show a wavepacket that is shoft slightly:
|
||
|
|
|
||
|
|
```.cpp
|
||
|
|
// 3. now we calculate several wavepackets and add a graph for each.
|
||
|
|
const size_t NWavepackets=7;
|
||
|
|
for (size_t nw=0; nw<NWavepackets; nw++) {
|
||
|
|
const size_t columnPacket=ds->addColumn(NSteps, "wavepacket1");
|
||
|
|
|
||
|
|
const double packwidth=0.4/static_cast<double>(NWavepackets);
|
||
|
|
const double pos=pow(static_cast<double>(nw), 0.6)*packwidth*3.5+5.0*packwidth;
|
||
|
|
const double wavelength=packwidth/1.5;
|
||
|
|
const double offset=(static_cast<double>(nw)*1.5+1.5);
|
||
|
|
for (size_t ti=0; ti<NSteps; ti++) {
|
||
|
|
const double t=ds->get(columnT, ti);
|
||
|
|
ds->set(columnPacket, ti, offset+sin(2.0*M_PI*t/wavelength)*exp(-0.5*jkqtp_sqr(t-pos)/jkqtp_sqr(packwidth)));
|
||
|
|
}
|
||
|
|
|
||
|
|
|
||
|
|
// 4. now we add three semi-transparent, filled curve plots, one for each histogram
|
||
|
|
JKQTPFilledCurveYGraph* graph=new JKQTPFilledCurveYGraph(&plot);
|
||
|
|
|
||
|
|
// set graph titles
|
||
|
|
graph->setTitle("wave "+QString::number(nw+1));
|
||
|
|
|
||
|
|
// set data
|
||
|
|
graph->setYColumn(columnT); graph->setXColumn(columnPacket);
|
||
|
|
|
||
|
|
// enable wiggle-plot filling
|
||
|
|
graph->setFillMode(JKQTPFilledCurveXGraph::TwoColorFilling);
|
||
|
|
// draw the data also as a black, thin line
|
||
|
|
graph->setLineColor(QColor("black"));
|
||
|
|
graph->setLineWidth(1);
|
||
|
|
// fill areas below the baseline with red
|
||
|
|
graph->setFillColor(Qt::transparent);
|
||
|
|
// fill areas above the baseline with blue
|
||
|
|
graph->fillStyleBelow().setFillColor(QColor("black"));
|
||
|
|
// set the baseline to be at 5 (not the default 0
|
||
|
|
graph->setBaseline(offset);
|
||
|
|
|
||
|
|
|
||
|
|
// add the graphs to the plot, so they are actually displayed
|
||
|
|
plot.addGraph(graph);
|
||
|
|
}
|
||
|
|
```
|
||
|
|
|
||
|
|
Also the colors are different: We use black below the baseline and transparent above. The line through the data points is black as well.
|
||
|
|
|
||
|
|
|
||
|
|
This is the resulting plot:
|
||
|
|
|
||
|
|

|